SDG 11. Sustainable cities and communities

We evaluate the thermal behaviour of urban eco-systems to adapt cities to climate change
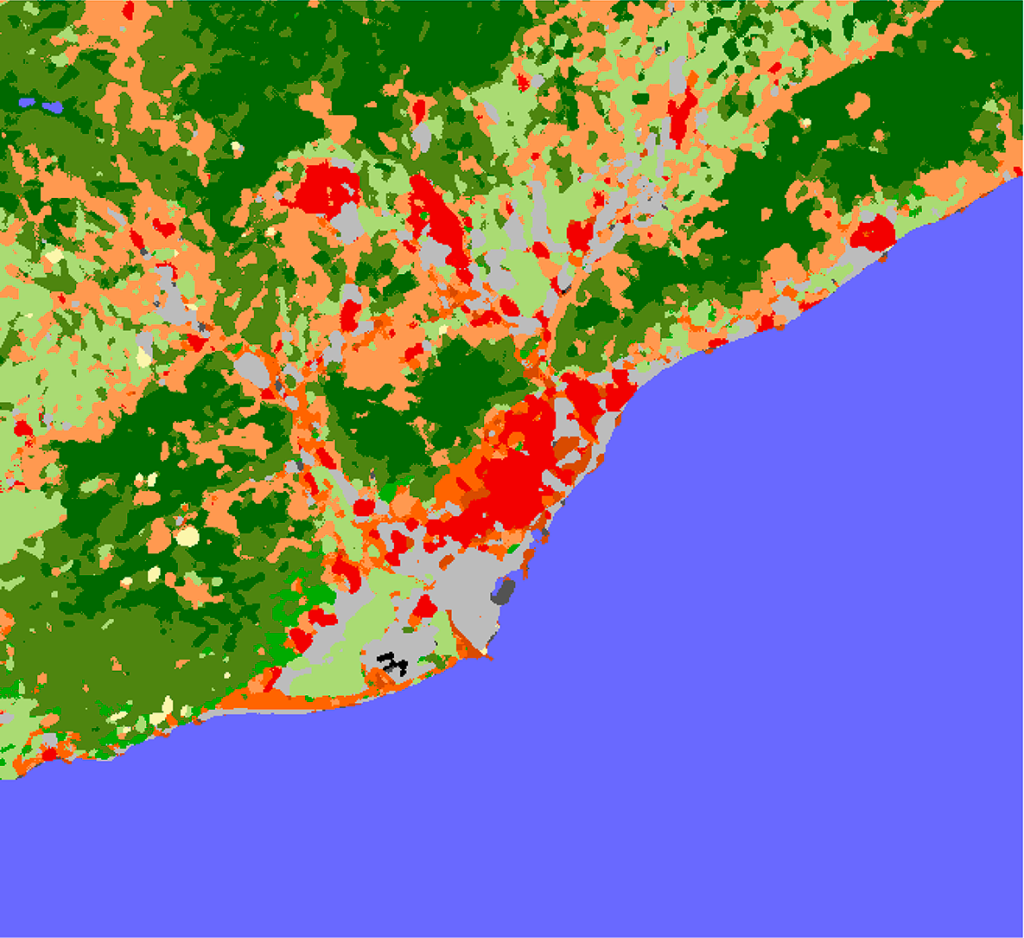
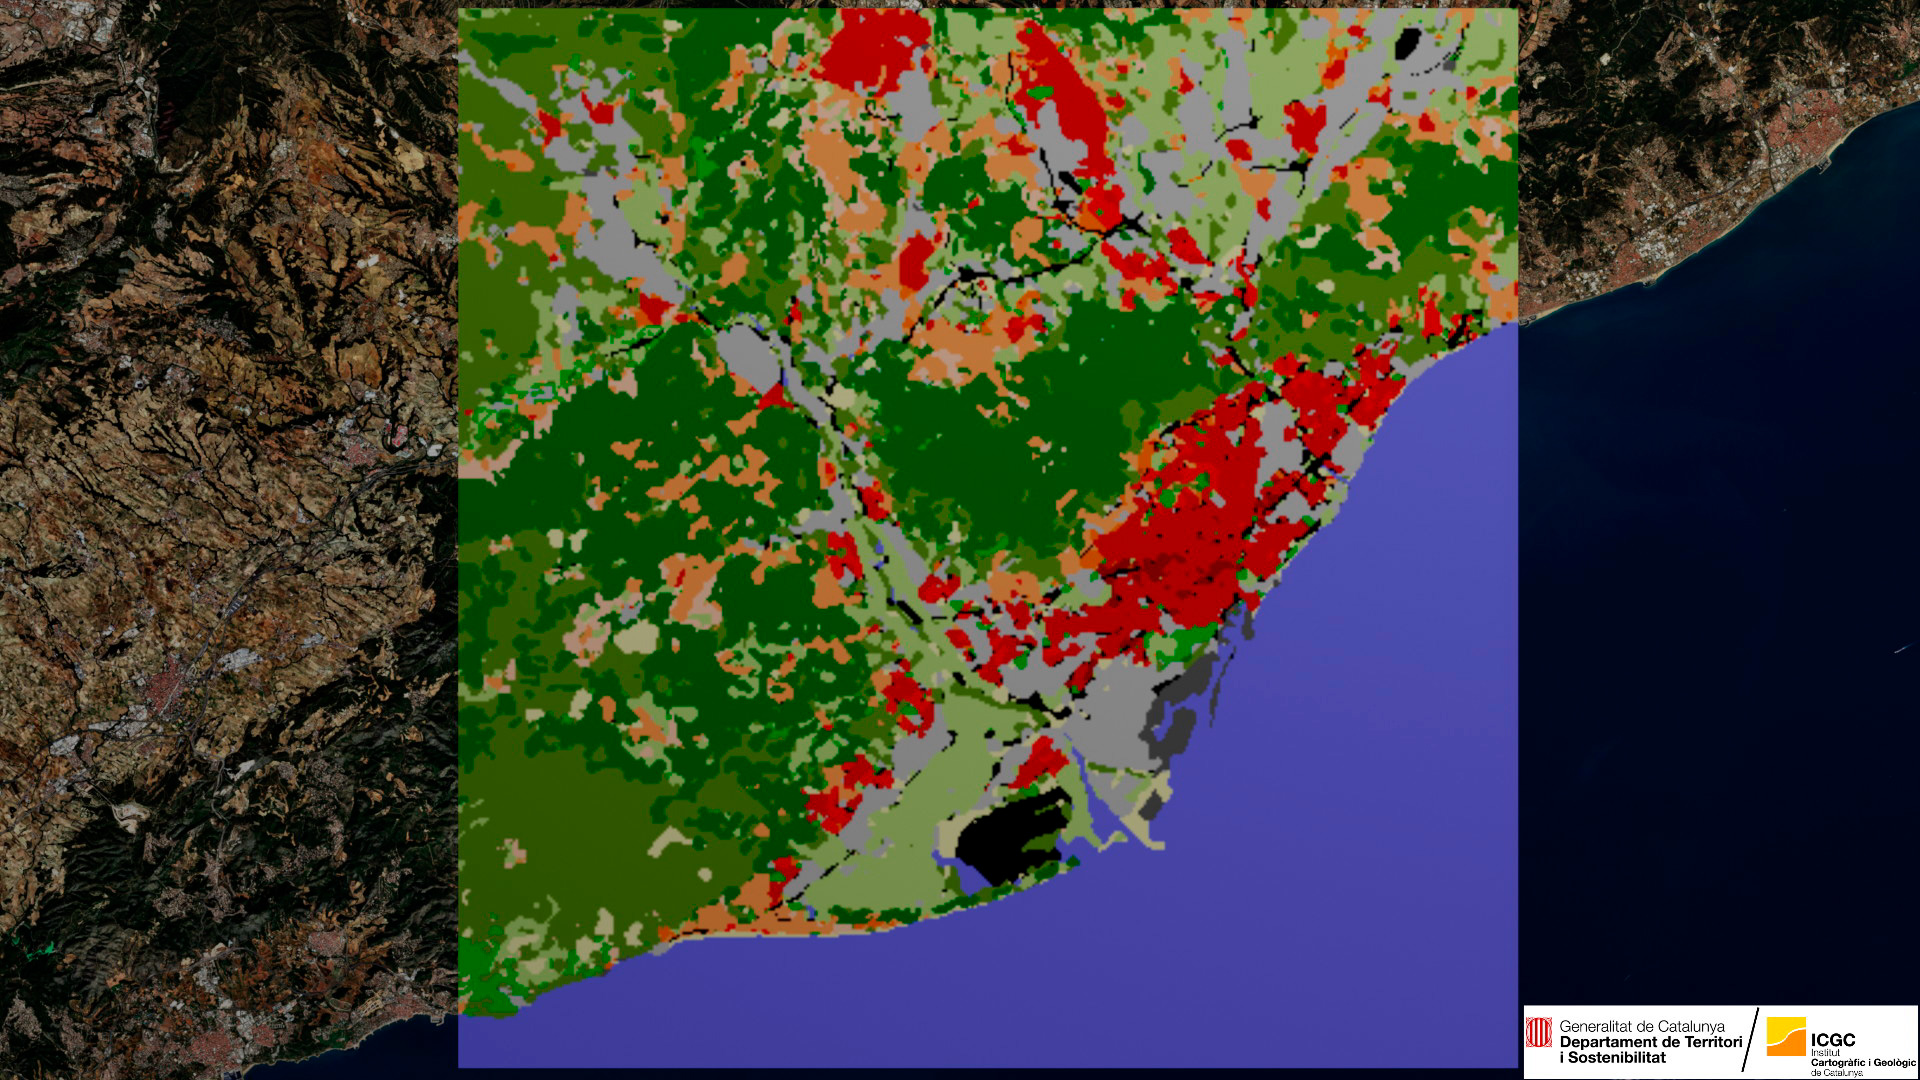
From satellite observation data we can produce alternative cartographies of Local Climate Zones (LCZ). LCZs are defined by an international standard based on radiative and metabolic properties, an essential tool for assessing thermal response

Doctor Jordi Corbera Simon, Head of the Earth Observation Area, Institute Cartographic and Geological of Catalonia (ICGC), Barcelona, Spain

Using earth observation data we can study the thermal response of urban ecosystems to climate change to help develop tools to assess the impact on populations and future urban planning.

Interview
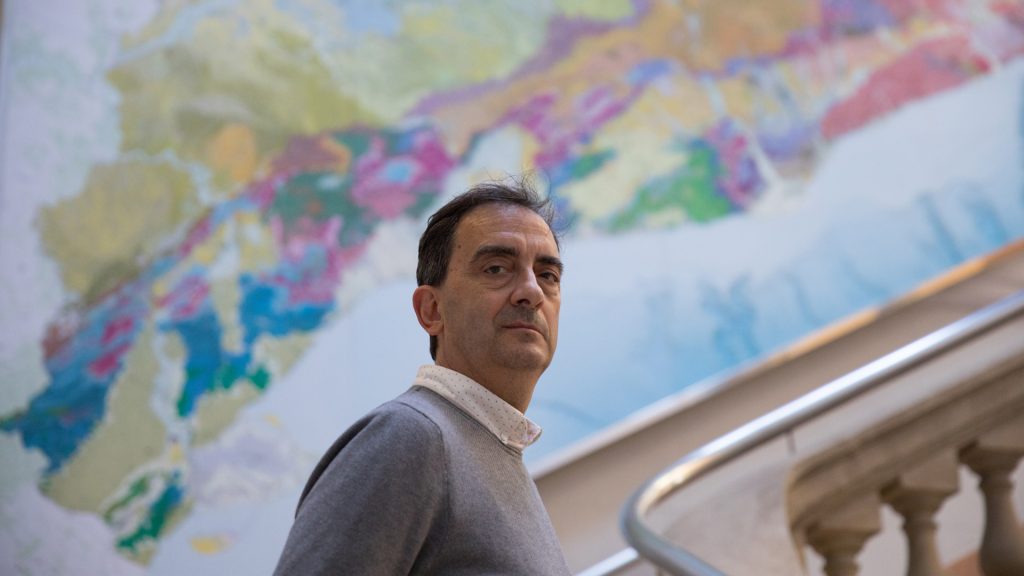
Jordi Corbera Simon
Photo: Eva Parey

My name is Jordi Corbera and I work for the Cartographic and Geological Institute of Catalonia (ICGC) as Head of Earth Observation. I have a Ph.D. in Physics and over the past 30 years I have been developing products and services based on the transformation of geospatial data, in particular using satellite navigation and earth observation assets.

I started my earth observation activity using satellite imagery to monitor changes to glaciers in Antarctica.
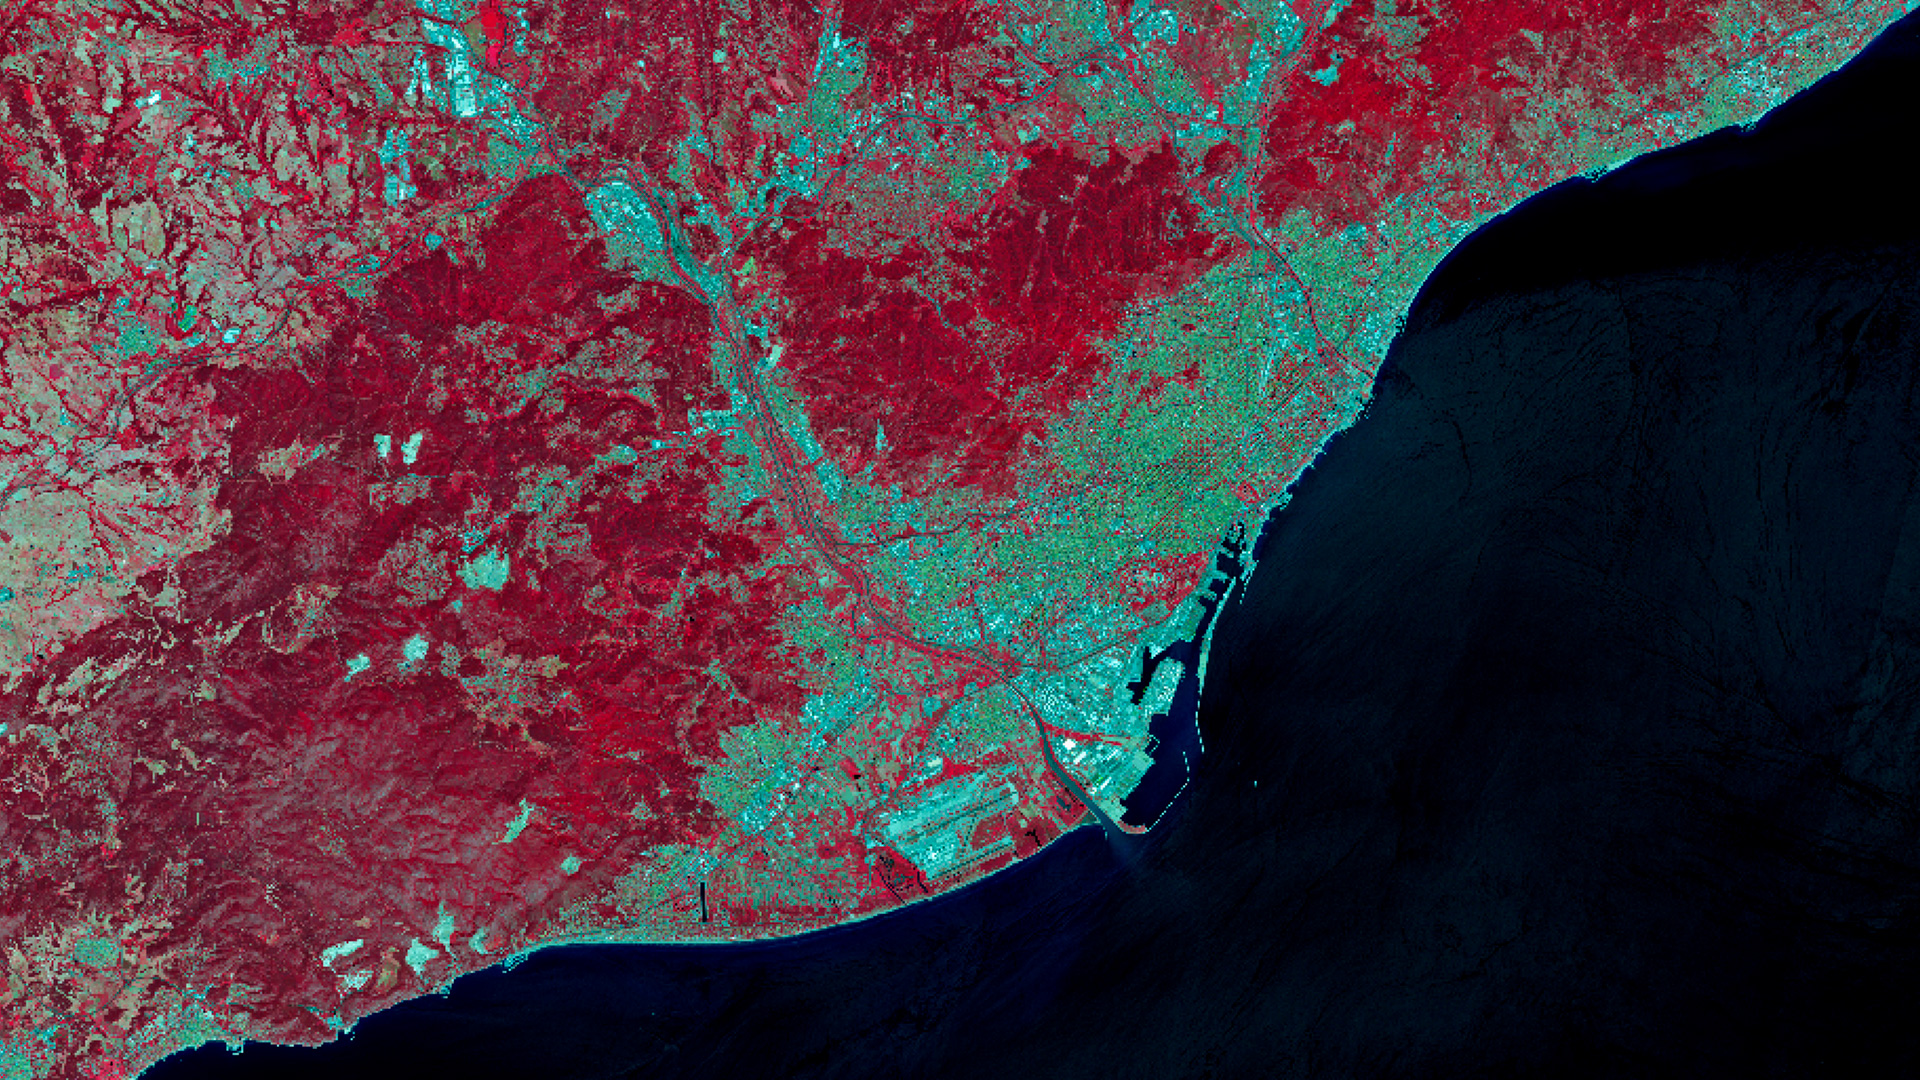
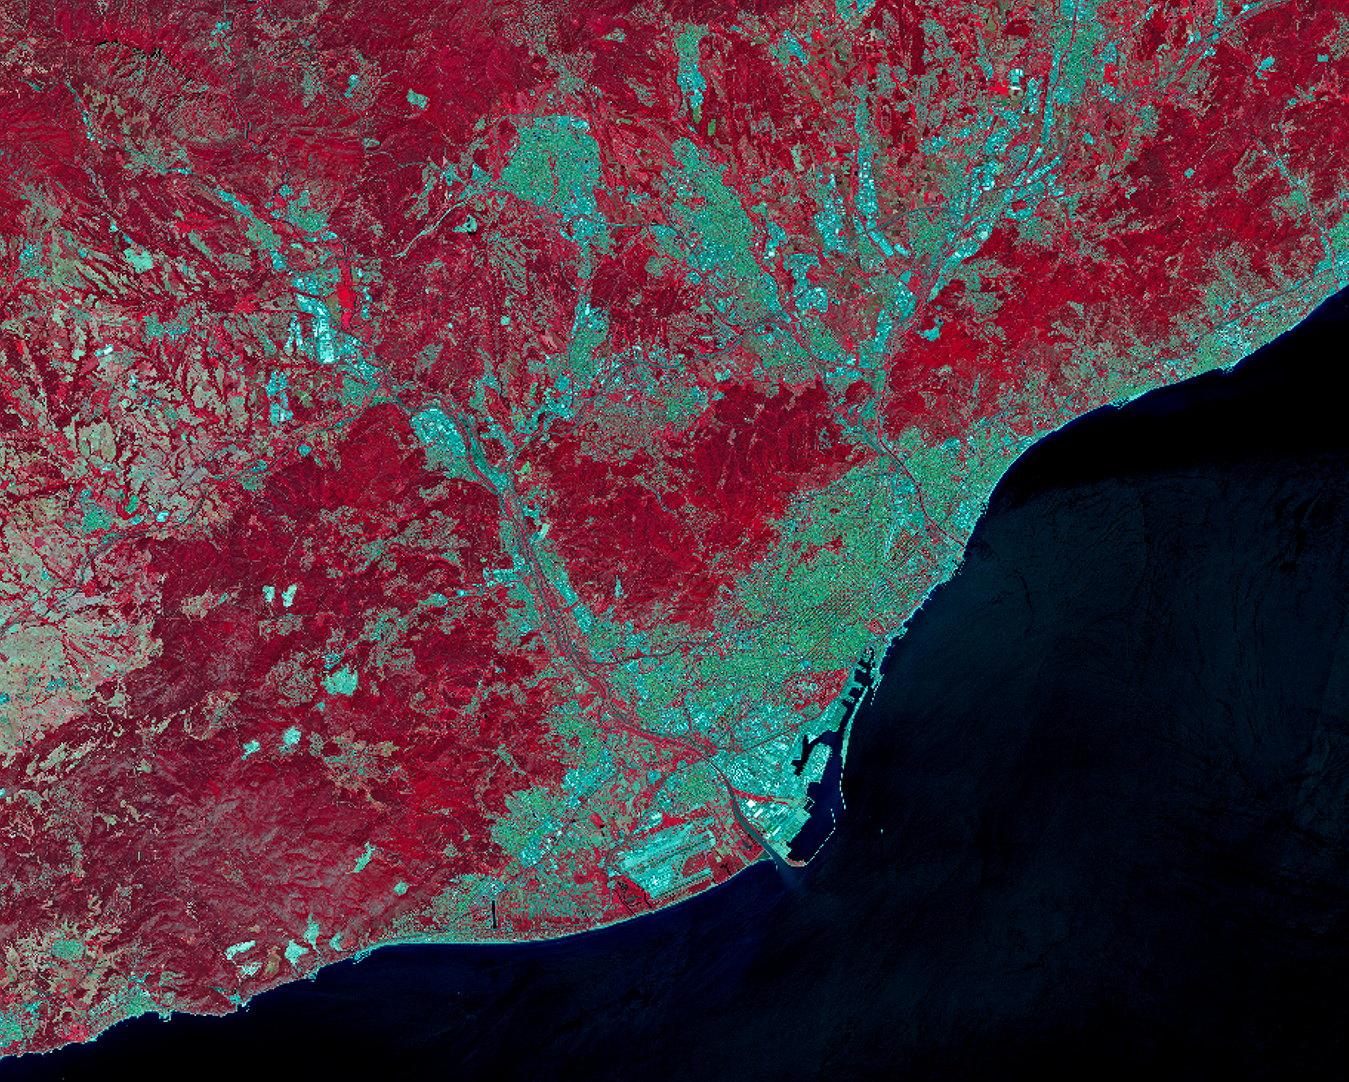
Spectral image from Copernicus Sentinel 2 of the metropolitan area of Barcelona. The red areas correspond to areas of vegetation. The blue zones indicate the urban ecosystem’s carbon footprint
Image: European Union, Copernicus Sentinel-2 imagery

One of the most relevant indicators of climate change are heat waves, which have become increasingly intense over time.

In 2003 more than 70,000 people died because of the heat wave in Europe; urban ecosystems especially suffered.

Barcelona is one of the densest cities in Europe and, due to its a Mediterranean climate, suffers from intense heat waves amplified by its population density and urban morphology, with only 7 square meters per inhabitant of urban green spaces, far below the recommended World Health Organization thresholds.

Using earth observation data we can assess the thermal response of urban ecosystems and integrate this into tools for analysis, prediction and simulation to help draw up climate policy in terms of urban design or population vulnerability. This is an essential tool for decision-makers.
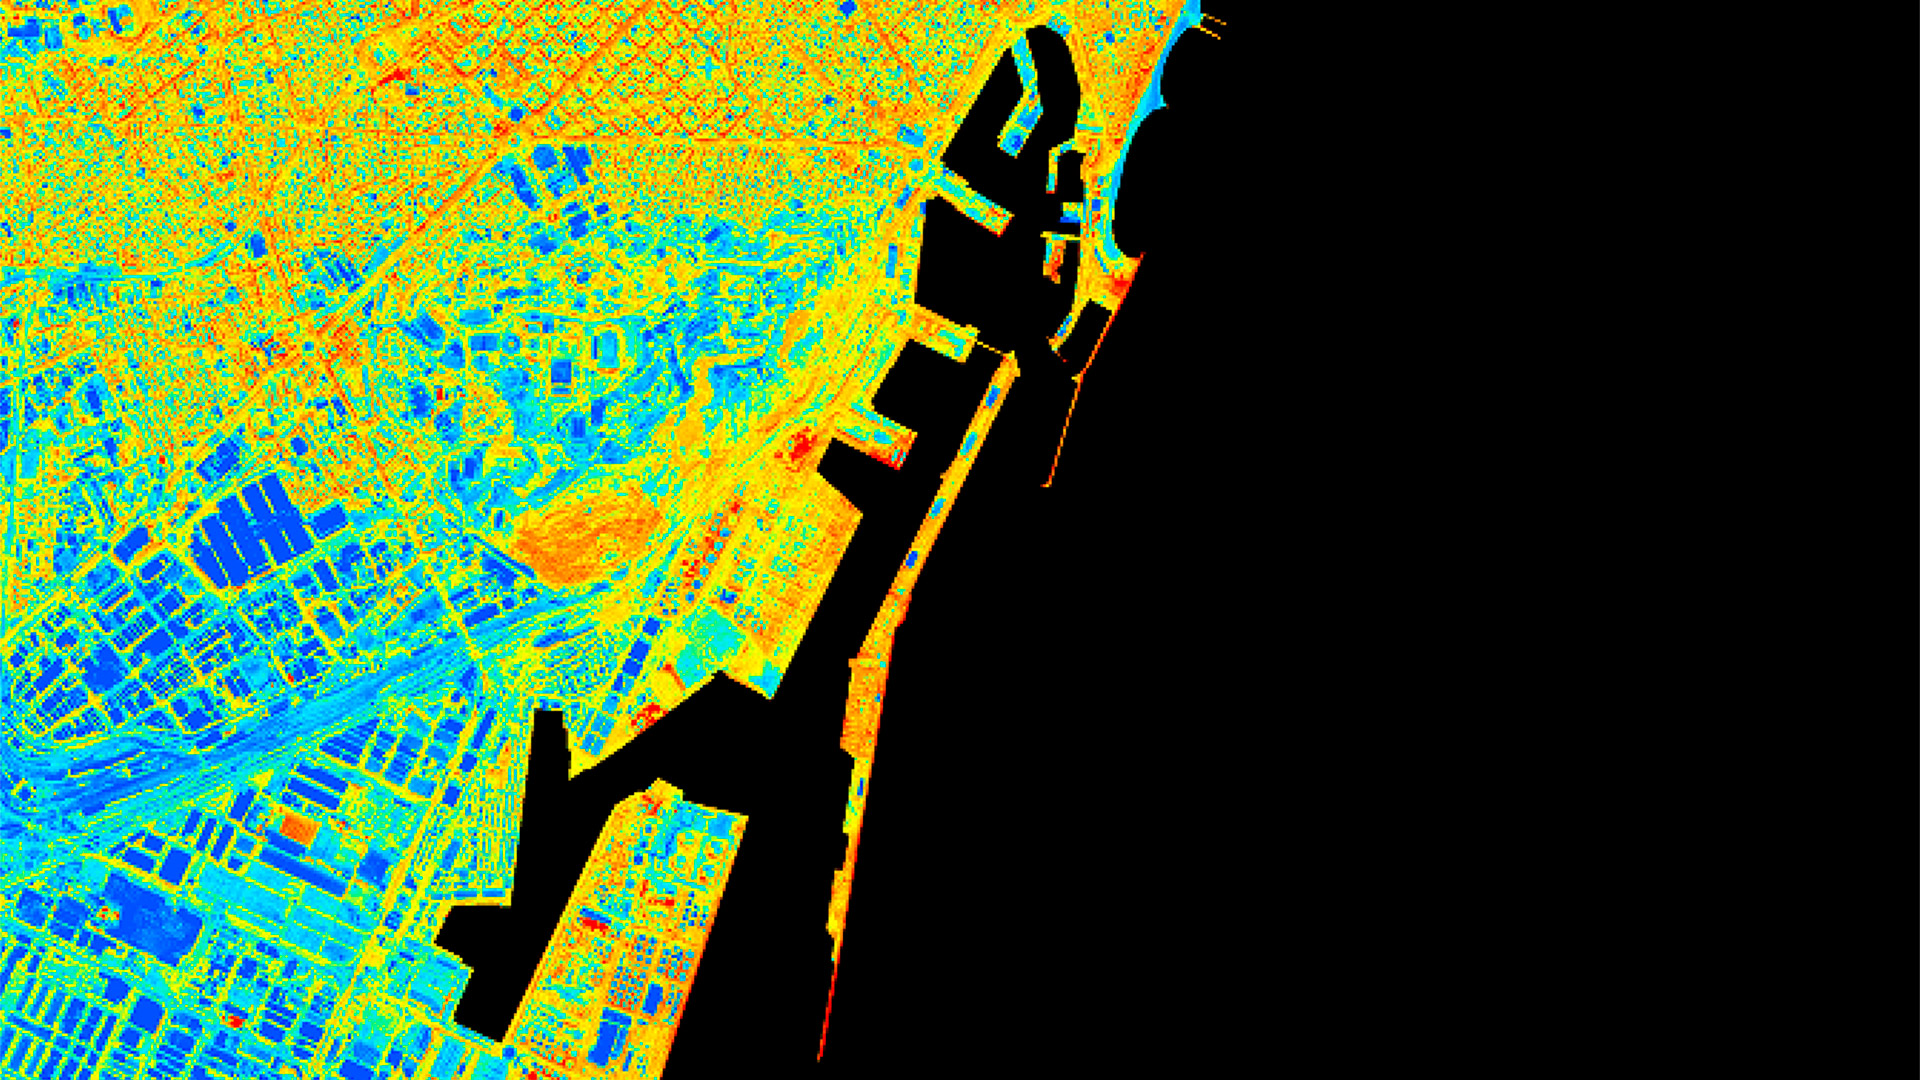
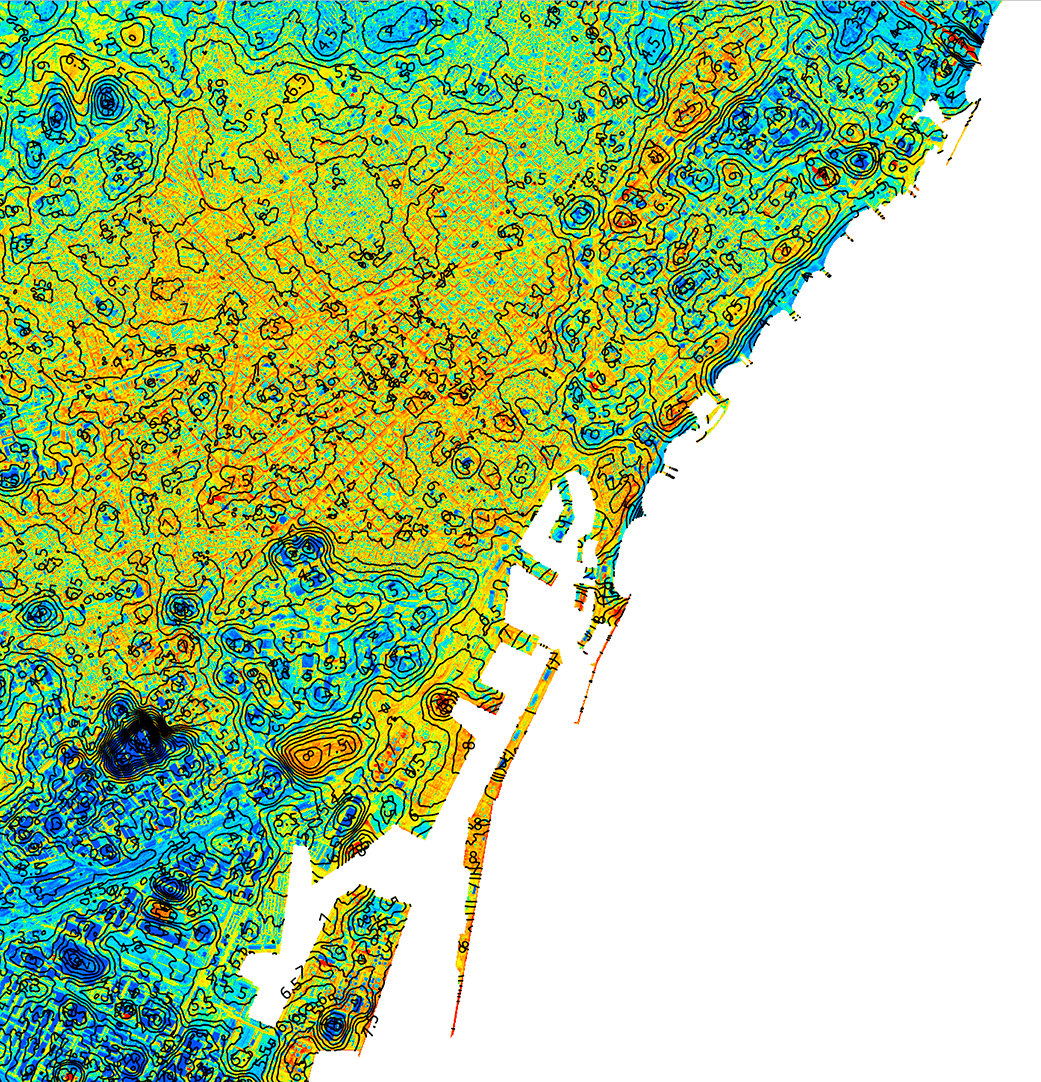
Space earth observation data are complemented with aerial socio-economic data and urban climate models to generate population vulnerability maps. In this image, we see land surface temperatures over Barcelona at very high spatial resolution (2 m.)
Image: ICGC

ICGC has developed operational workflows to chart Local Climate Zones and develop new risk and vulnerability maps, using earth observation datasets from space,

in particular from Sentinel 2 and Sentinel 3’s Copernicus European Union programme as well as from airborne platforms.

Using this cartography we can generate maps of populations’ vulnerability to heat waves and combine this information with demographic datasets and urban climate models, increasing the resolution of Copernicus Sentinel-3’s thermal information to a high-resolution 1km to 100m

Our major goals, in my humble opinion, are not to focus on smart cities but on sustainable cities and how we can use data from space to achieve sustainable goals.

My message to visitors is to promote new talents and new vocations to help us develop more innovative solutions to solving the challenges to the planet Earth.

At ICGC we are a team made up of people with backgrounds in geography, topography, physics, engineering, IT, mathematics and biology among others, because space technologies offer us a multidisciplinary vision of our planet.

Gallery
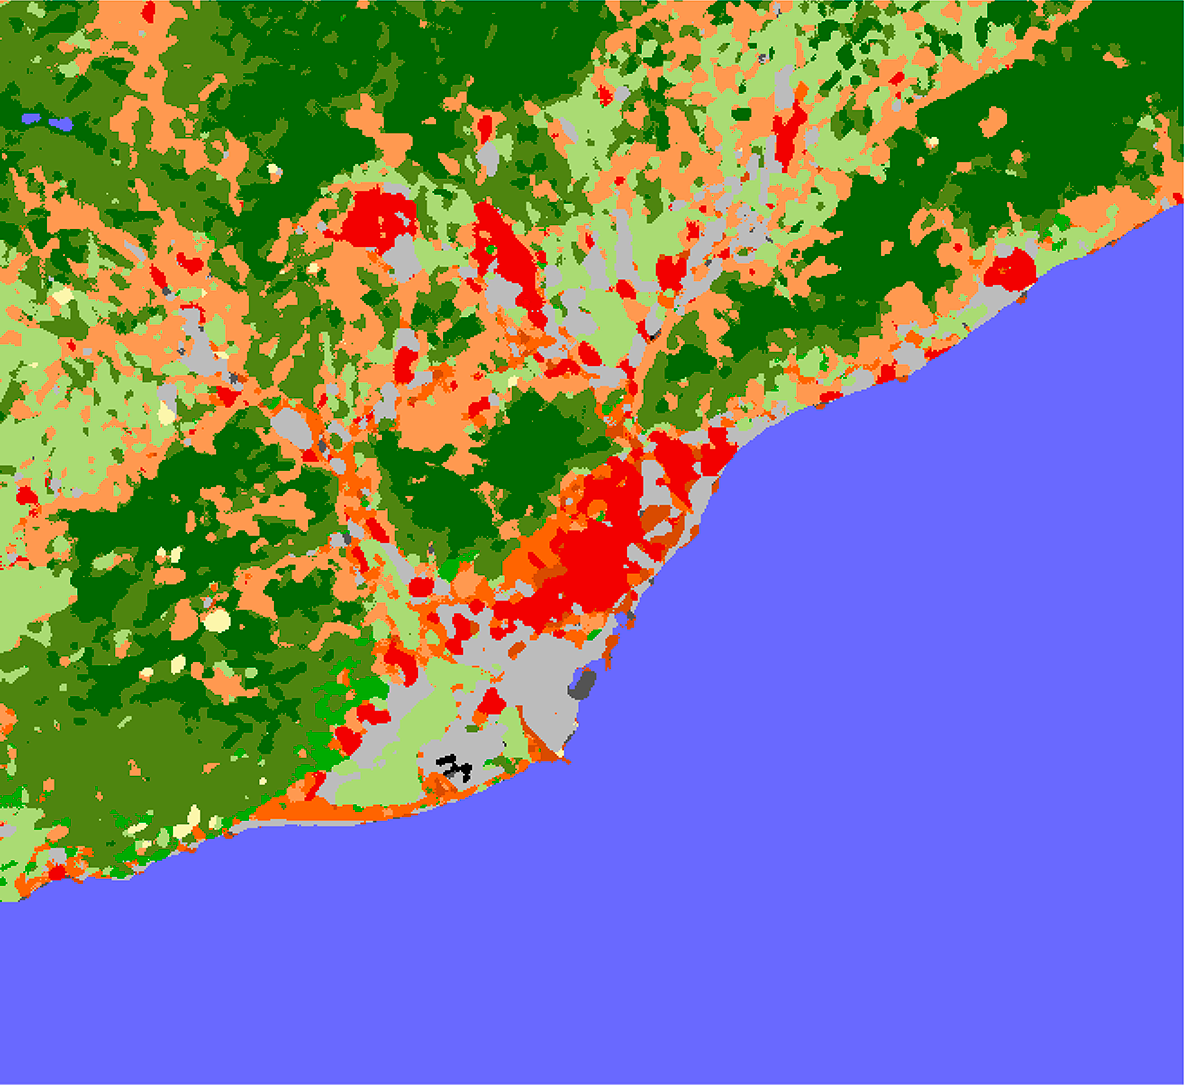
From satellite observation data we can produce alternative cartographies of Local Climate Zones (LCZ). LCZs are defined by an international standard based on radiative and metabolic properties, an essential tool for assessing thermal response
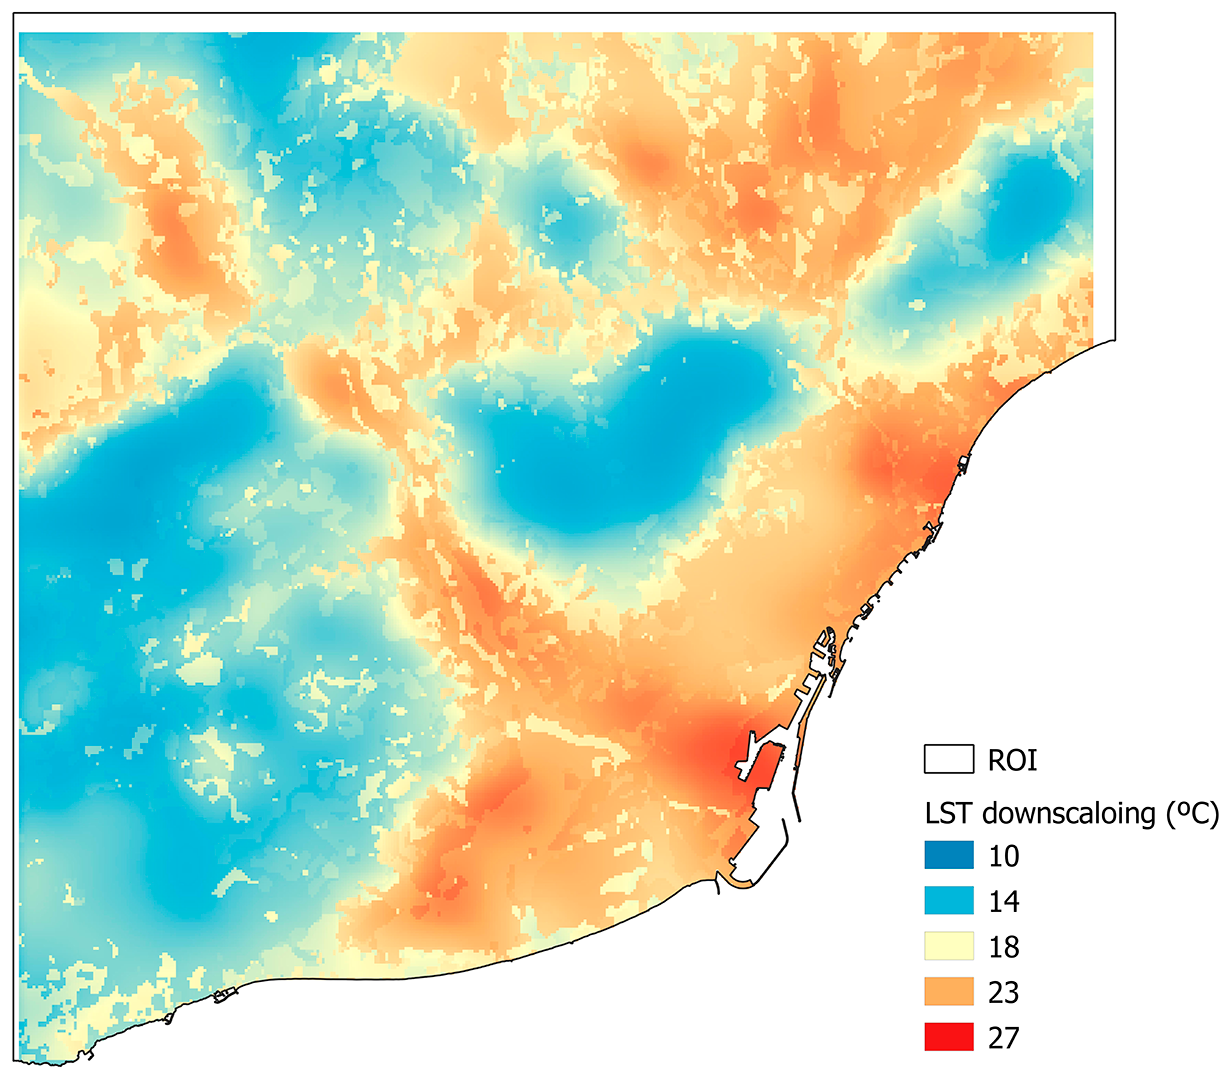
From earth observation data provided by Sentinel 3 using LCZ cartography, the original spatial resolution of 1km of land surface is increased to 100 m resolution which makes urban thermal behaviour clearly visible and helps support climate action
From earth observation data of land surface temperature we use a reference temperature outside the urban zone to draw up Urban Heat Island (U.H.I.) maps. When the difference between the urban temperature and the reference temperature exceeds 4-4.5°C, as we see in the metropolitan area of Barcelona, UHI phenomena become very apparent.
Spectral image from Sentinel 2 of the metropolitan area of Barcelona. The red areas correspond to areas of vegetation. The blue zones indicate the urban ecosystem’s carbon footprint
Spectral image from Sentinel 2 of the metropolitan area of Barcelona. The red areas correspond to areas of vegetation. The blue zones indicate the urban ecosystem’s carbon footprint Image: European Union , Copernicus Sentinel-2 imagery
From satellite observation data we can produce alternative cartographies of Local Climate Zones (LCZ). LCZs are defined by an international standard based on radiative and metabolic properties, an essential tool for assessing thermal response
From satellite observation data we can produce alternative cartographies of Local Climate Zones (LCZ). LCZs are defined by an international standard based on radiative and metabolic properties, an essential tool for assessing thermal response Image: ICGC
From earth observation data provided by Sentinel 3 using LCZ cartography, the original spatial resolution of 1km of land surface is increased to 100 m resolution which makes urban thermal behaviour clearly visible and helps support climate action
From earth observation data provided by Sentinel 3 using LCZ cartography, the original spatial resolution of 1km of land surface is increased to 100 m resolution which makes urban thermal behaviour clearly visible and helps support climate action Image: ICGC
Space earth observation data are complemented with aerial socio-economic data and urban climate models to generate population vulnerability maps. In this image, we see land surface temperatures over Barcelona at very high spatial resolution (2 m.)
Space earth observation data are complemented with aerial socio-economic data and urban climate models to generate population vulnerability maps. In this image, we see land surface temperatures over Barcelona at very high spatial resolution (2 m.) Image: ICGC
From earth observation data of land surface temperature we use a reference temperature outside the urban zone to draw up Urban Heat Island (U.H.I.) maps. When the difference between the urban temperature and the reference temperature exceeds 4-4.5°C, as we see in the metropolitan area of Barcelona, UHI phenomena become very apparent.
From earth observation data of land surface temperature we use a reference temperature outside the urban zone to draw up Urban Heat Island (U.H.I.) maps. When the difference between the urban temperature and the reference temperature exceeds 4-4.5°C, as we see in the metropolitan area of Barcelona, UHI phenomena become very apparent. Image: ICGC

From space technologies such as Sentinel 2’s Copernicus Program we can create maps of Local Climate Zones (LCZ). We can then combine these with Sentinel 3 land surface temperature data at a resolution of 1 km to 100 m to obtain maps of Urban Heat Island phenomena
Source: ICGC

Under the patronage of

With the support of