SDG 9. Industry, innovation and infrastructure

We are going to be able to follow the behaviour of glaciers in real time
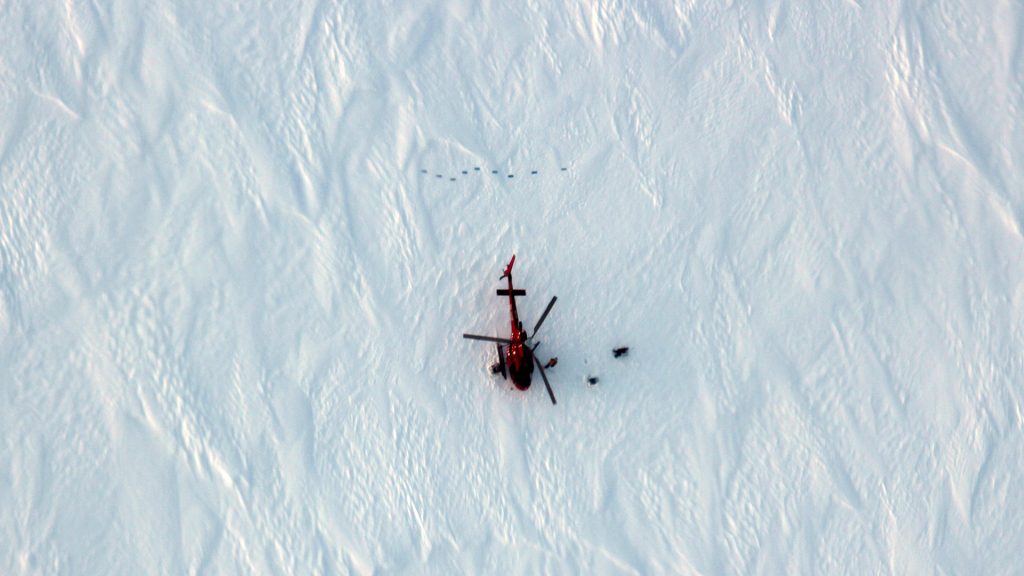
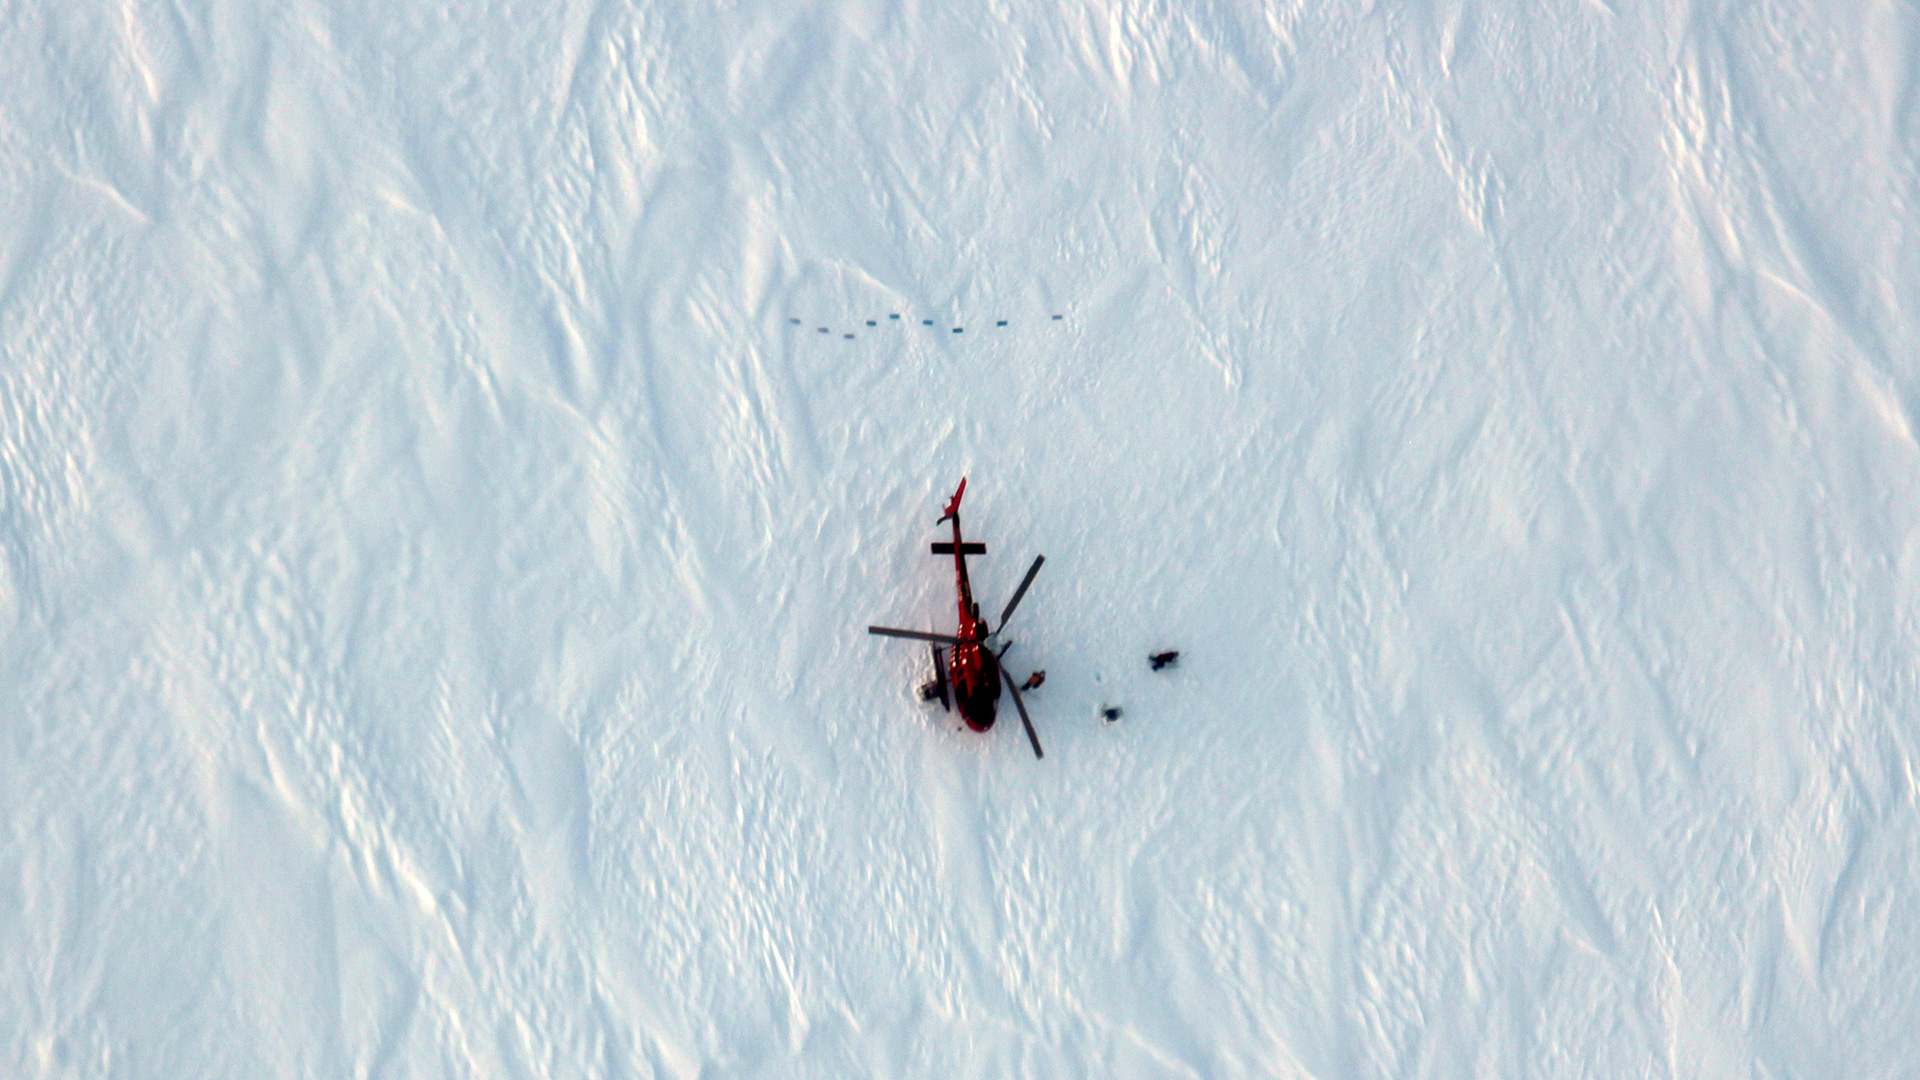
Scientists working on the Greenland ice sheet as part of an international effort to develop new space technology to monitor our changing polar environment.

Elizabeth Bagshaw, Glaciologist
Cardiff University, United Kingdom

For glaciologists working in polar regions, data transmission is a real problem. There are no telephone networks, or wifi and electricity. Thanks to Astrocast, a constellation of satellites launched in partnership with the ESA, we receive essential scientific information that reveals glacial melting on a daily basis.

Interview

Elizabeth Bagshaw
Photo: Lisa Mol

I’m a glaciologist and a senior lecturer working at Cardiff University. I’m really interested in finding new ways for measuring how meltwater comes from the top of and underneath the Greenland ice sheet. One of the things that we’re really interested in is to try and find out what the impact of increasing temperatures will be on ice sheets. With Greenland and Antarctica, we know that as the temperatures get warmer, you get an increase in surface melting. And we know that meltwater has to go from the surface to somewhere.
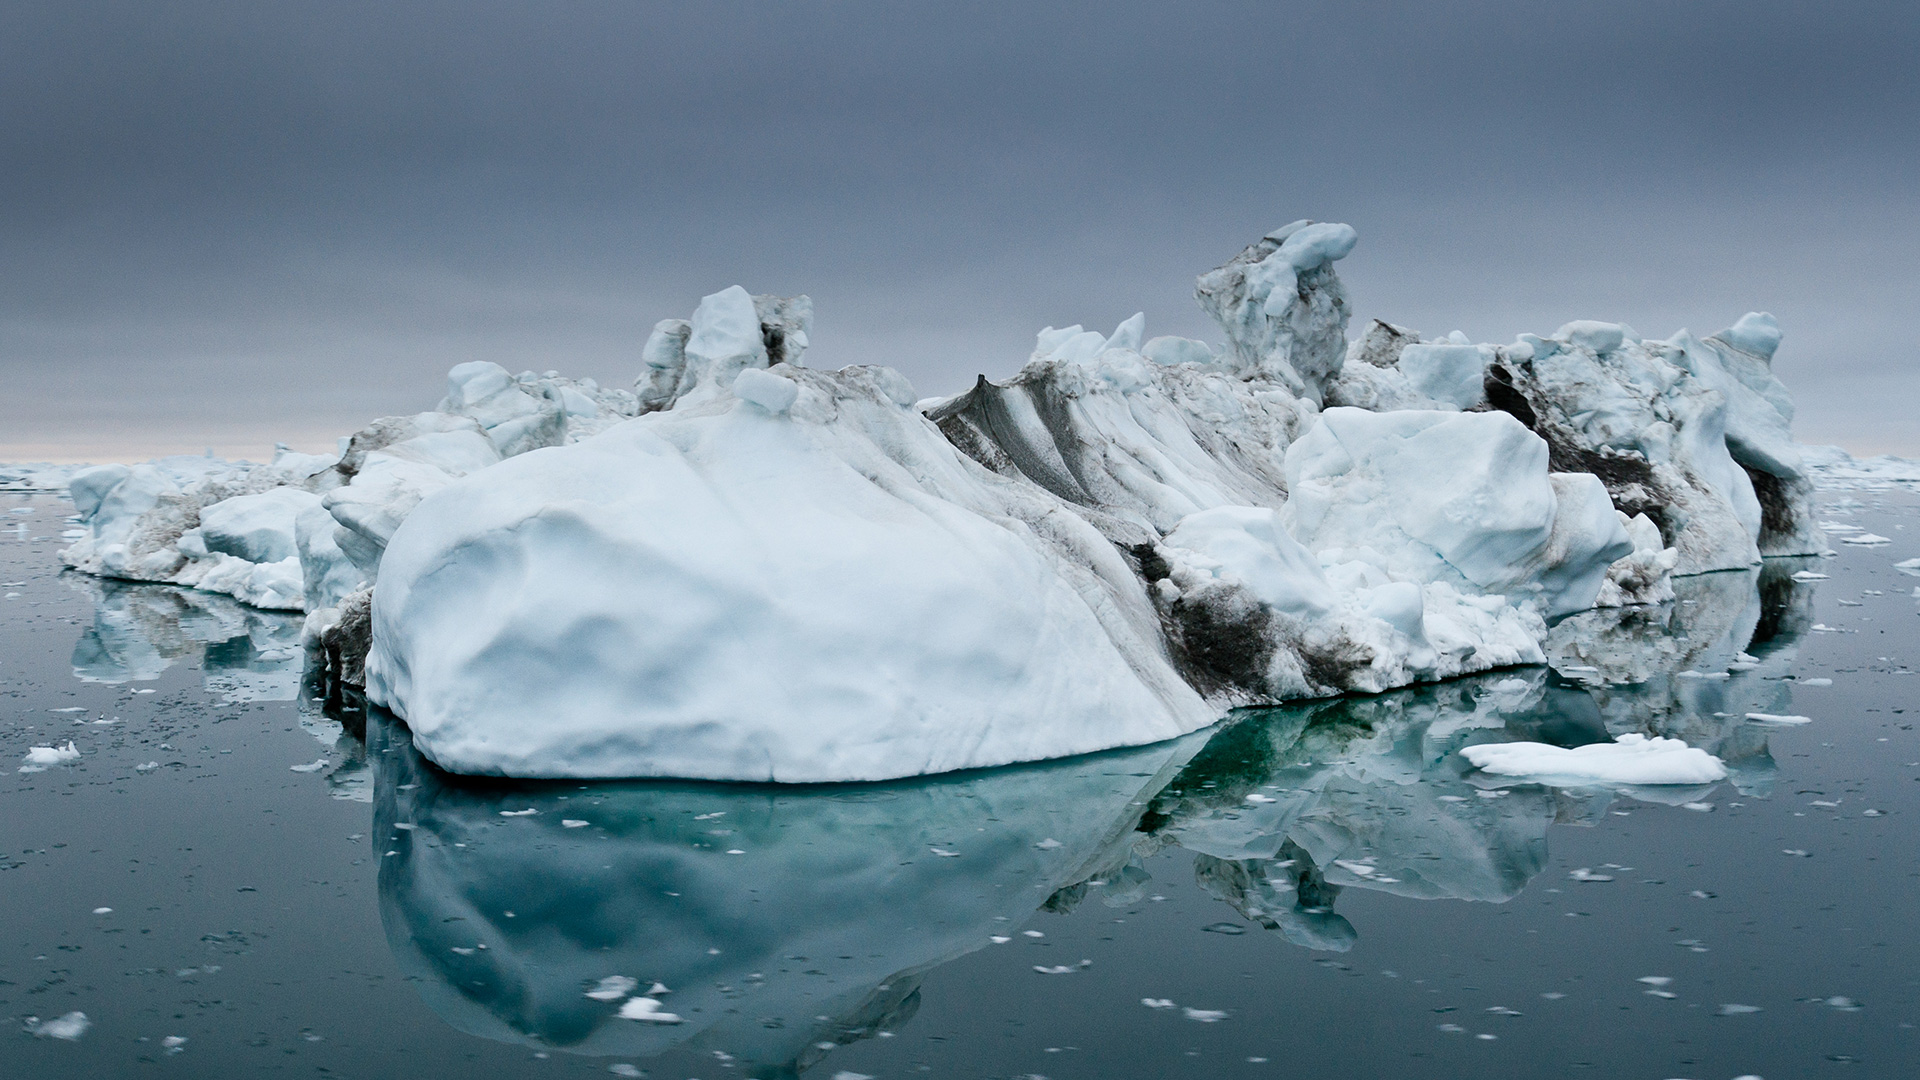
A recent report confirms that ice sheets in Greenland and Antarctica, whose melting rates are rapidly increasing, are matching the Intergovernmental Panel on Climate Change's worst-case climate warming scenarios.
Photo: ESA / I. Joughin

And what happens with many ice sheets is that meltwater burrows its way down holes known as moulins, after the French for windmill.

The water mills its way down into the ice and bores a hole. The water then ends up underneath the ice, trapped between the hard ice above and the hard bedrock below. With that water layer, the ice flows much faster because you’ve reduced the friction at the ice speed interface. The problem is that this can cause a much faster flow of ice down towards the sea. And when it heads towards the sea, it ends up at lower elevation and melts faster. Then you end up with more melting and an increased rise in the sea level. However, it’s not quite as simple as we think. And what we have seen in alpine glaciers is how water underneath the ice organizes itself into river channels, just like on land.

Then you get a series of big channels where the water prefers to flow. These channels actually end up reducing the friction on some areas of the bed. So after that initial speed up, the ice begins to slow down again, which means that there’s a complicated relationship between the melting happening on the ice surface and rise in sea level in the future.

So what we try to do is figure out where and when these channels form and we do that by measuring the pressure, temperature and a number of other parameters underneath the ice.
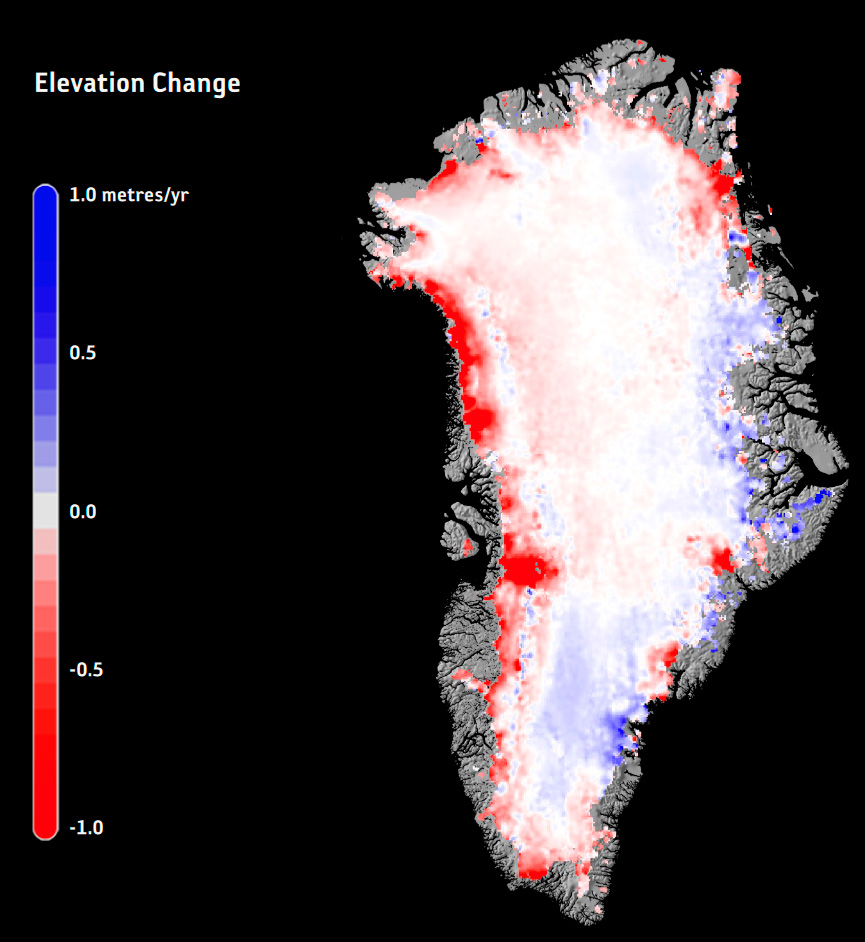
The image shows Greenland ice-sheet annual elevation change in 2015, but using a 25-year record of ESA satellite data, recent research shows that the pace at which Greenland is losing ice is getting faster. The research, published in Earth and Planetary Science Letters, uses radar altimetry data gathered by the ERS, Envisat and CryoSat missions between 1992 and 2016.
Image: ESA/Planetary Visions

With these measurements, you can paint a picture of where those channels might form, and how they might behave in the future. The problem is the depth beneath the ice; ice in Greenland and Antarctica can be up to 3-4 kilometres thick. So getting that information from underneath the ice and back to the surface is a real challenge. That’s the problem we’re trying to approach in order to find new ways to get that information back to the surface.

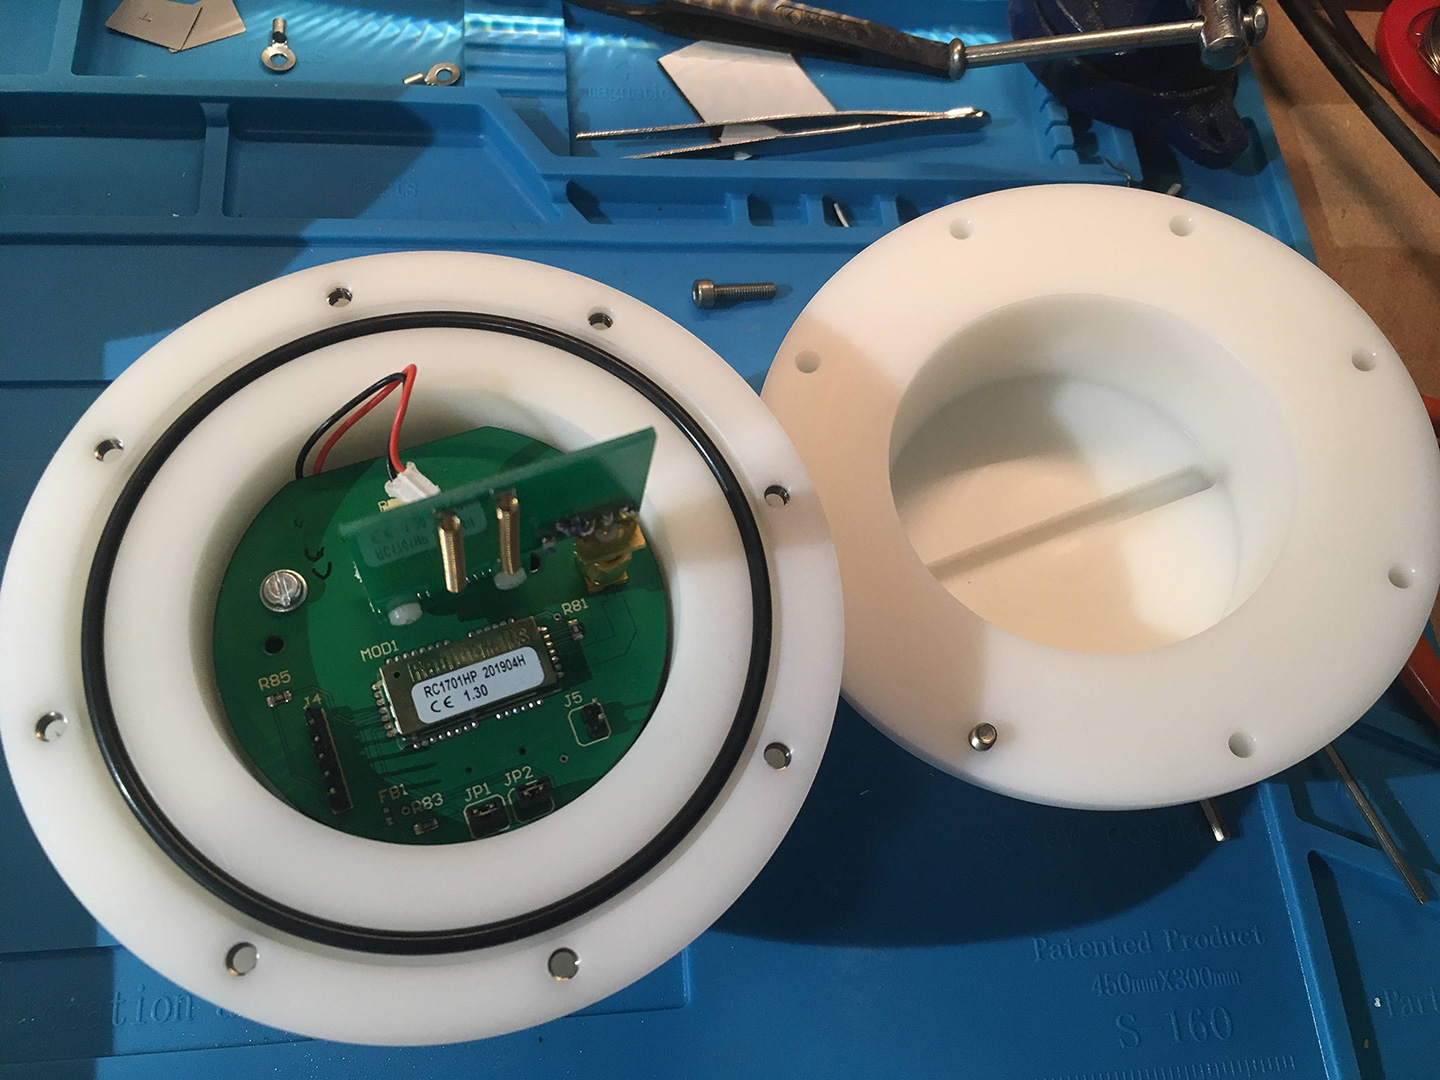
The technology that we’re developing is based around an instrument called the “Cryoegg”, a technology that can take those measurements underneath the ice and transmit them from the bottom of the ice all the way up to the surface. Cryoegg is a sort of grapefruit-sized device that we make in our workshops in Cardiff. Onboard the Cryoegg are sensors that measure the temperature of the water underneath the ice, the pressure of the water underneath the ice and the electrical conductivity of that water.
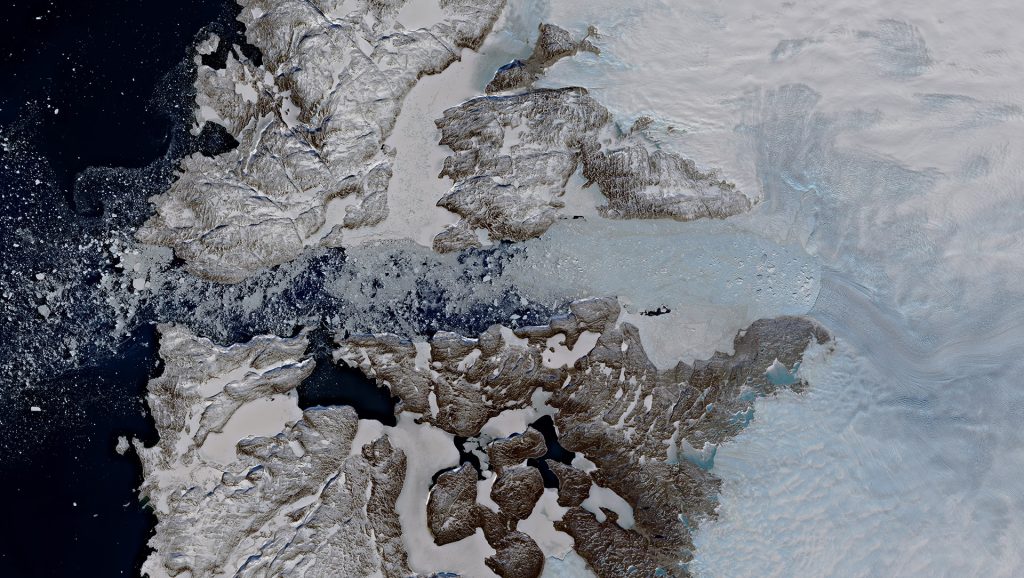
Jakobshavn Glacier,Greenland, Copernicus Sentinel 2 mission Jakobshavn Glacier, one of the most dynamic glaciers in the world, has contributed to the largest ice loss in Greenland.

Cellular systems cover only about 10% of the world’s surface area. In extreme topographies such as deserts, glacial areas, mountains,  forests etc., Internet of Things (IoT) combined with a low earth orbit satellite constellation provides a new way to track, measure and communicate with assets anywhere on Earth. Connected devices can exchange data automatically, reliably, and at reasonable cost, with a global coverage. These space-based services open a wide range of opportunities for industrial applications, maritime navigation, and environmental research and enable us to monitor equipment usage and improve logistics in the world's remotest areas.
Photo: ESA, mission Sentinel 2, Copernicus

The electrical conductivity gives us information about how long the water has been stored underneath the ice. So the sensors on board Cryoegg can measure those three things. The data is then recorded onto the Cryoegg and transmitted to the surface using a radio frequency chip on board the Cryoegg. And because it’s wireless and free of any cables, it can move around underneath the ice and give lots of information about the characteristics of the water. Once the Cryoegg has sent the data back to the surface, we need to find a way to get it home again. If you were working in a densely populated area, you might be able to use mobile phone technologies or wifi to send the data on.

But in the middle of the ice sheet, there’s no mobile phone coverage and there’s definitely no Wi-Fi. So we need to rely on space technologies to transport our data for us.

So, our receiver sends out a little chirp of data several times a day to coincide with when the satellite is passing overhead. The satellite receives the data and then pings it back to our home computers when it passes over our country.
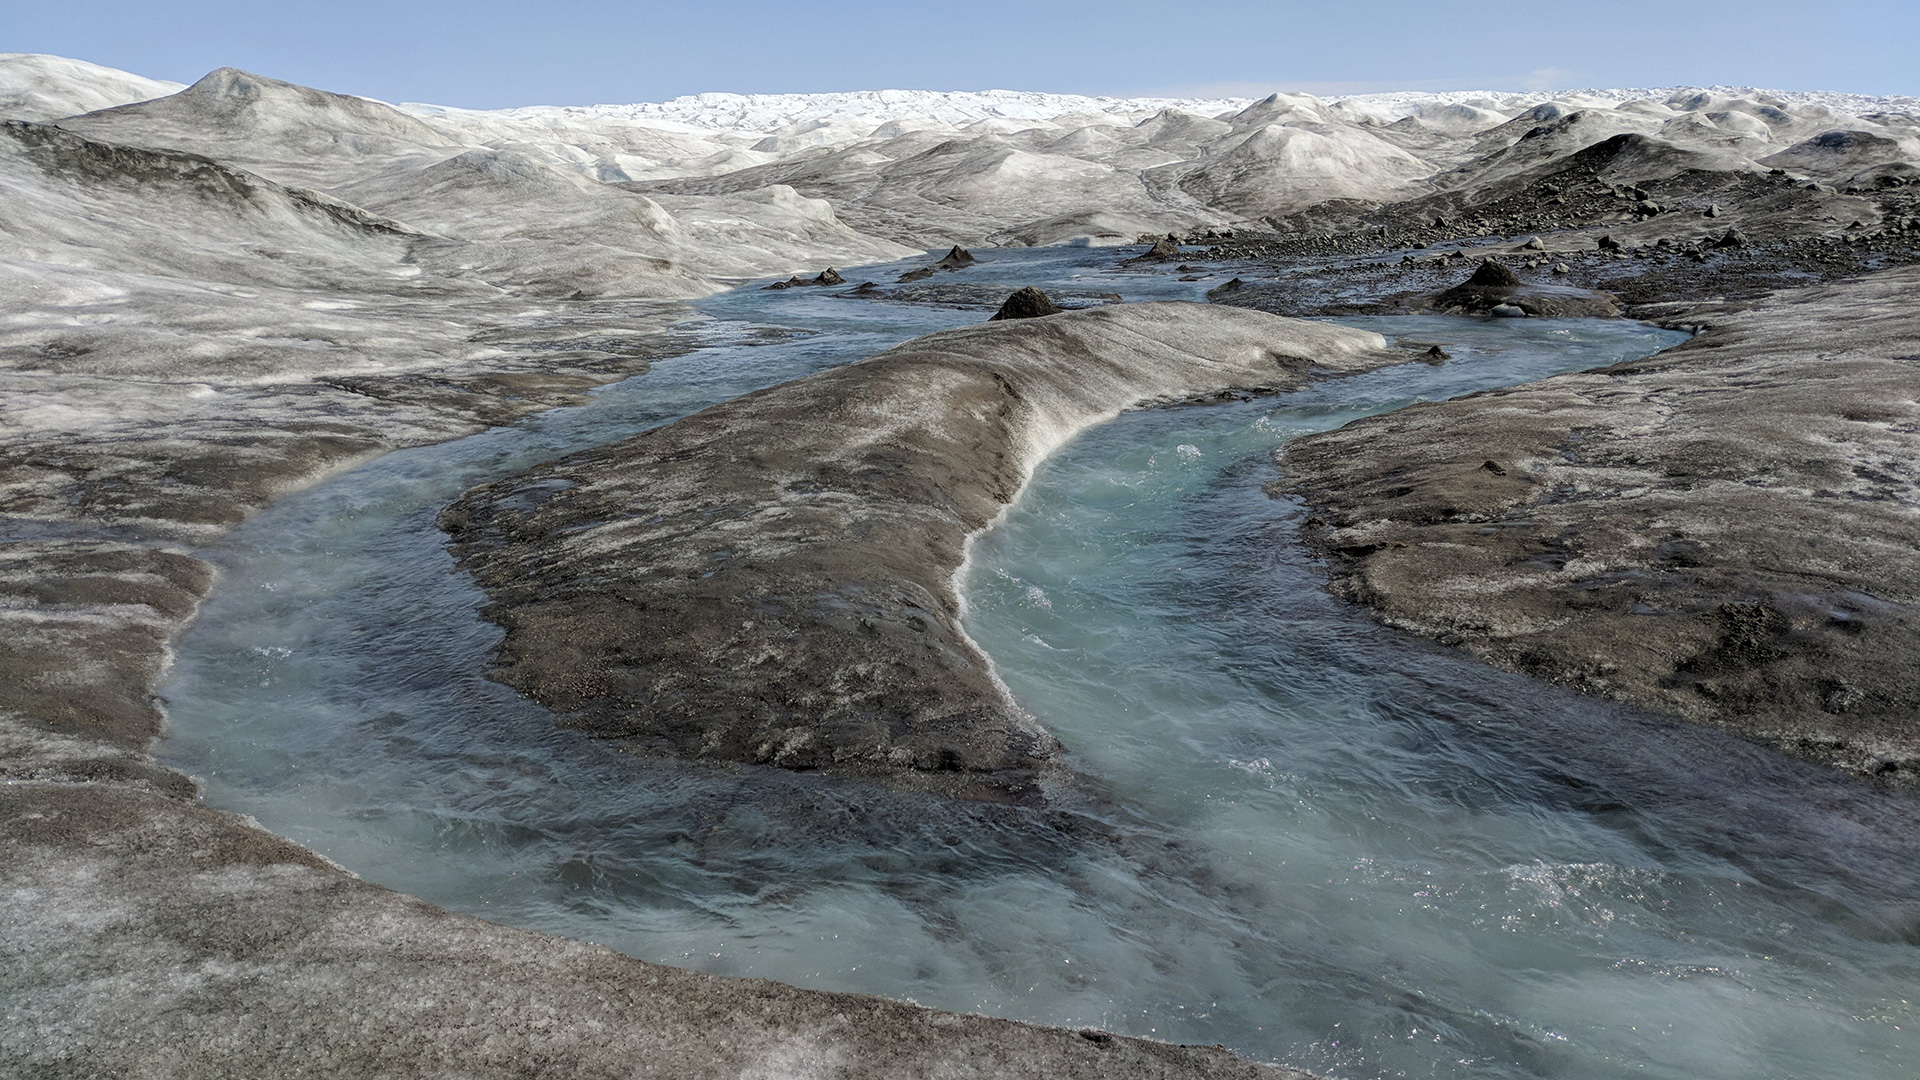
Meltwater channels on the surface of Russell Glacier in Greenland. The dark material is a mix of wind-blown dirt and microbial matter that can hasten the melting of the ice.
Photo: Elizabeth Bagshaw

So it’s a really neat way of getting data back without having to have someone sitting on the ice sheet the whole time downloading data onto their laptop. It means that the Cryoegg can explore underneath the ice and send the data back in near real time. Those data can be seen even if we’re not out in the polar regions. A lot of the satellite technologies until now have been quite expensive but scientists have had to use satellite technologies to get their data back from the polar regions. What’s happened in the last couple of years is a new generation of lower cost satellites. We’ve been really excited to work with Astrocast to test some of these lower cost options to transmit those data.

One of the reasons that we’re using Astrocast in our trials is that not only is it a low cost option, which means we can send small amounts of data very, very regularly, but also the parts that it uses don’t use much power.

And that’s a real benefit for us because working in the polar regions, as well as having no mobile phone reception and no Wi-Fi when you’re out in the middle of the ice sheet, there’s also no mains electricity.

We have to rely on batteries and solar power to run all our instruments. Some of the earlier models of satellite modem used an awful lot of power. And we had to consider this when designing our receiving stations. Astrocast is really nice because the transmitter module is quite low-power, as well as being low-cost, and it’s quite small. This means we can pack it all into our transceiver box, leave it up on the surface of the ice sheet and wait for the data to come home.
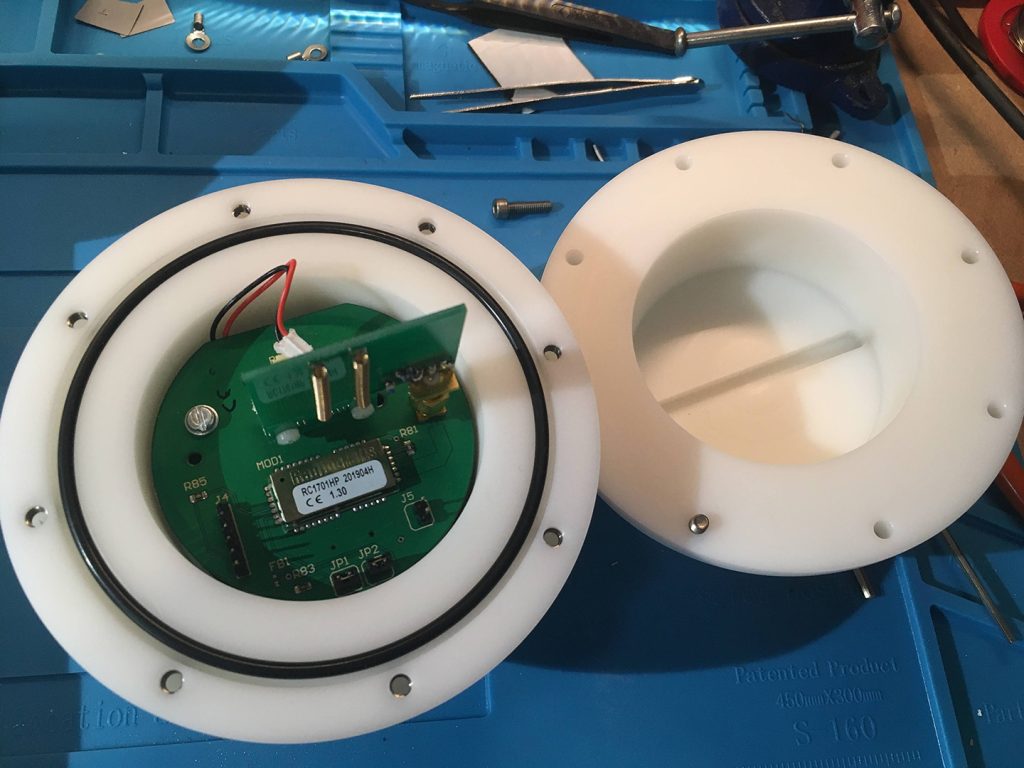
Onboard the Cryoegg are sensors that measure the temperature of the water underneath the ice, the pressure of the water underneath the ice and the electrical conductivity of that water. the Cryoegg can explore underneath the ice and send the data back in near real time.
Photo: Mike Prior-Jones

The message that I want to give when visiting this exhibition is that all this science has been made possible by combining lots of different fields of expertise.

So teamwork is what has made this piece of technology possible. And teamwork is how we’re going to solve the problem of how the ice sheets are melting and how they’re going to respond in the future. We’re a team of scientists, including glaciologists, ice sheet modellers, climate modellers and engineers, people who work with instrument development, people who work on communications and space, scientists who are working on satellite technologies and companies that work on developing the instruments. All together we’ve been able to answer some of the big questions, and we hope that we can continue to do this work in the future and try and find out how our ice sheets are going to respond to climate change.

Gallery
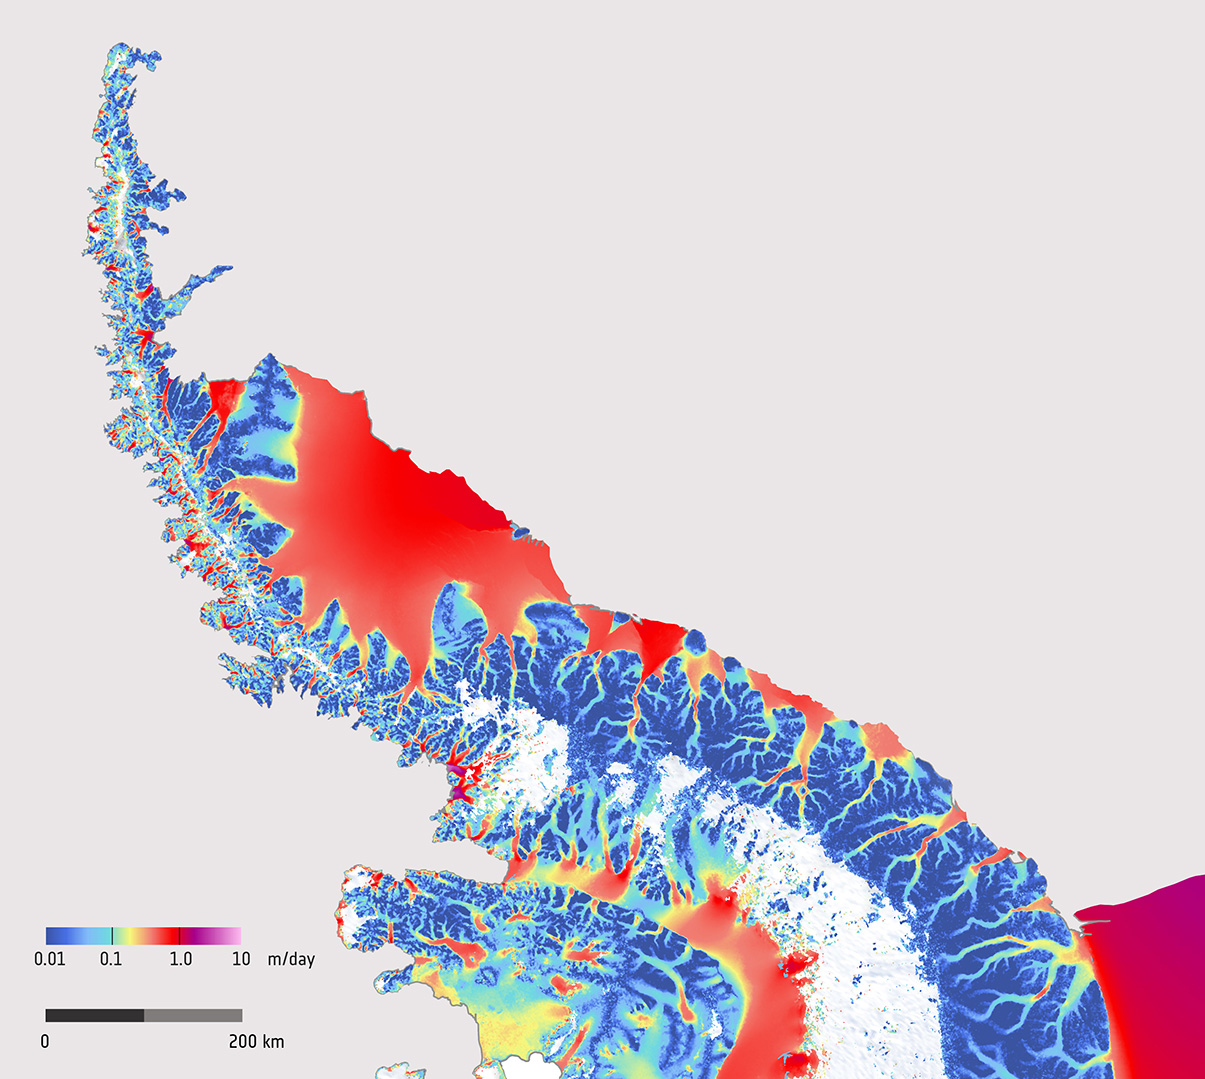
This image shows the use of data from the Copernicus Sentinel-1 mission for routine mapping and monitoring the surface velocity of glaciers and ice sheets. The combination of Sentinel-1A and -1B will support comprehensive and long-term monitoring of changes in ice sheet velocity and how they respond to climate change.
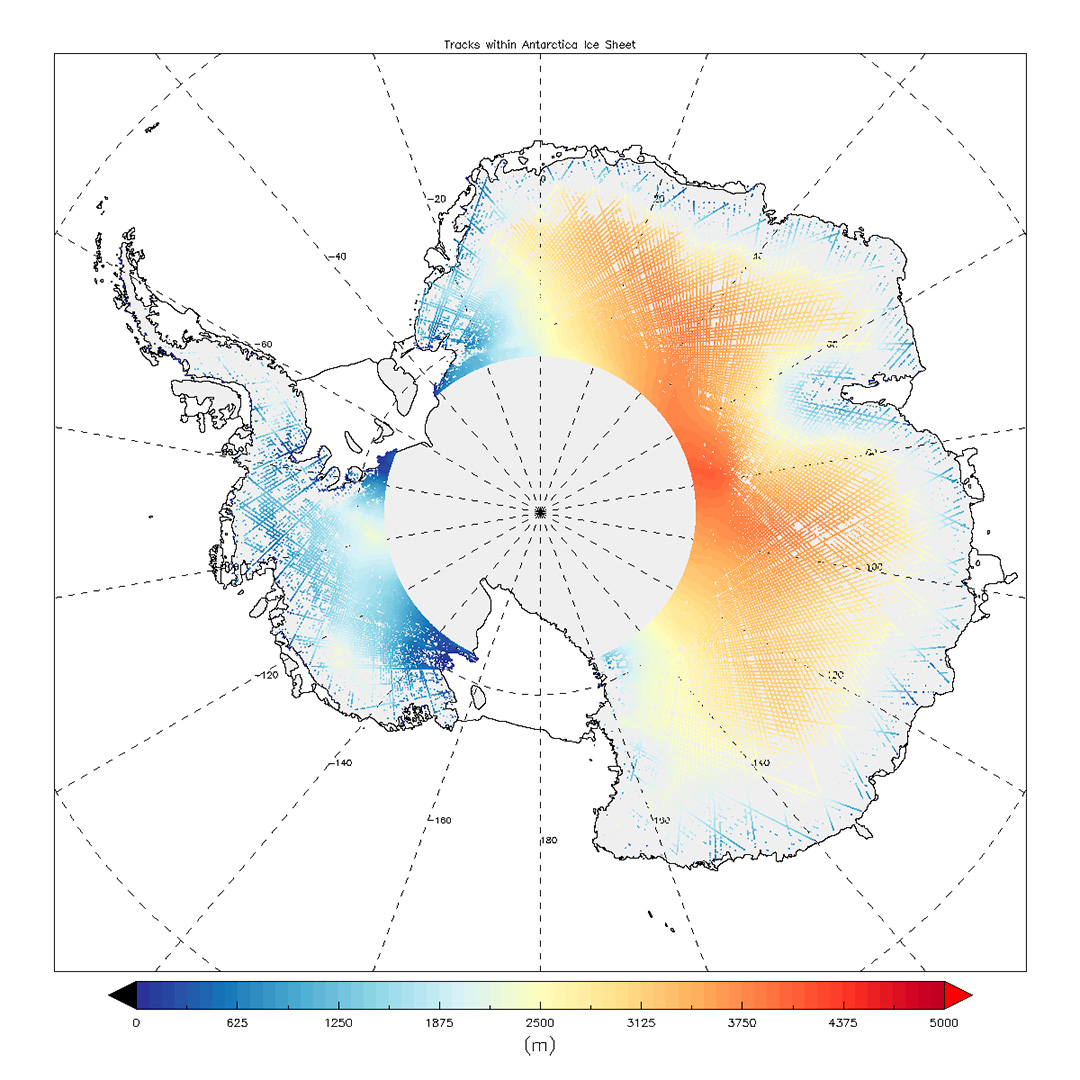
Sentinel-3A’s topography package provides accurate topography measurements over sea ice, ice sheets, rivers, lakes and land. As this image of Antarctica shows, the radar altimeter is also important for measuring changes in the height of land ice.
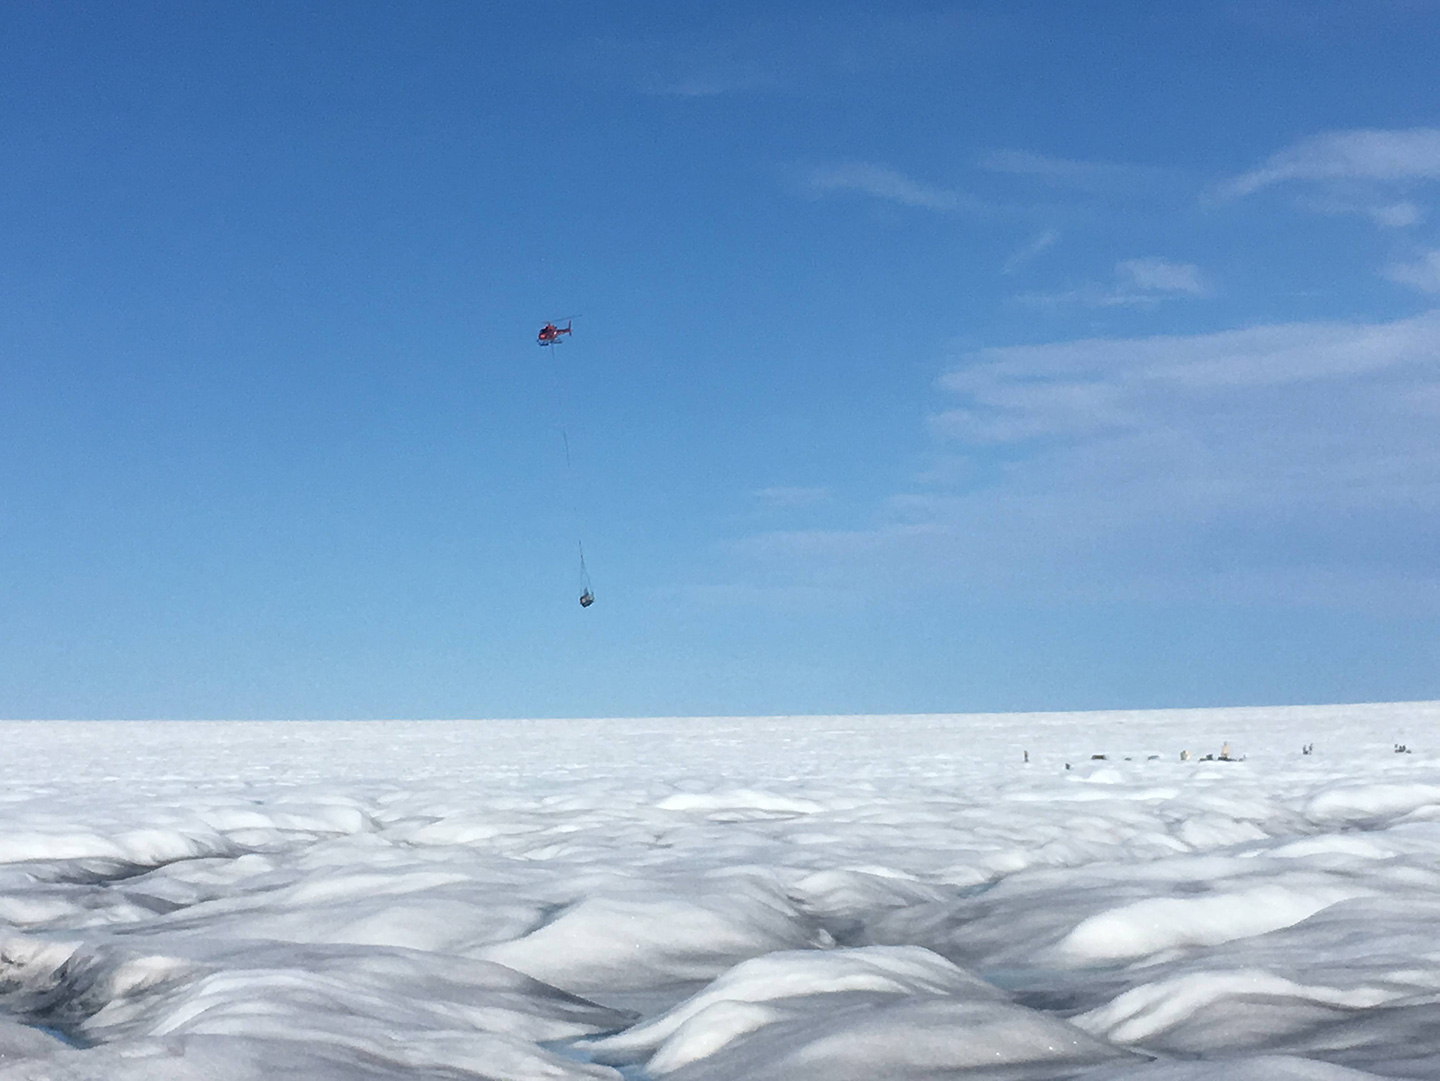
Vital supplies arrive by helicopter at the field camp on Sermeq Kujalleq, Greenland.
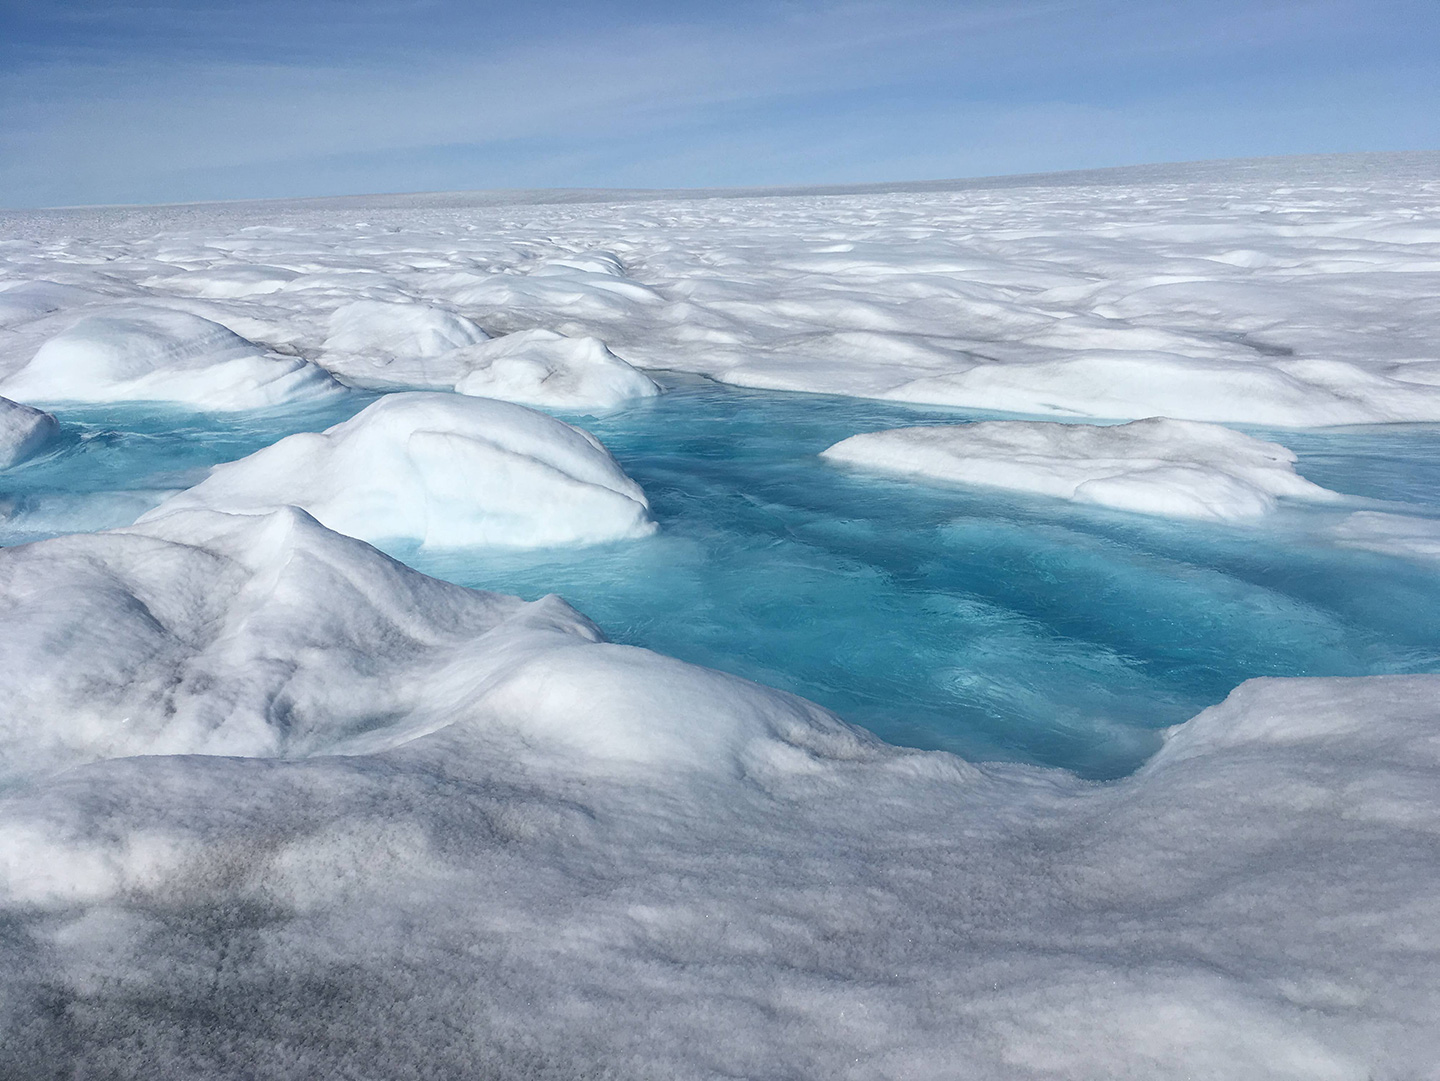
Surface meltwater ponds at Sermeq Kujalleq, Greenland. This meltwater will find its way to the bottom of the ice through a network of cracks, crevasses and moulins.
A recent report confirms that ice sheets in Greenland and Antarctica, whose melting rates are rapidly increasing, are matching the Intergovernmental Panel on Climate Change's worst-case climate warming scenarios.
A recent report confirms that ice sheets in Greenland and Antarctica, whose melting rates are rapidly increasing, are matching the Intergovernmental Panel on Climate Change’s worst-case climate warming scenarios. Photo: ESA / I. Joughin
This image shows the use of data from the Copernicus Sentinel-1 mission for routine mapping and monitoring the surface velocity of glaciers and ice sheets. The combination of Sentinel-1A and -1B will support comprehensive and long-term monitoring of changes in ice sheet velocity and how they respond to climate change.
This image shows the use of data from the Copernicus Sentinel-1 mission for routine mapping and monitoring the surface velocity of glaciers and ice sheets. The combination of Sentinel-1A and -1B will support comprehensive and long-term monitoring of changes in ice sheet velocity and how they respond to climate change. Image: ESA/ modified Copernicus Sentinel data (2015), processed by Enveo
Sentinel-3A’s topography package provides accurate topography measurements over sea ice, ice sheets, rivers, lakes and land. As this image of Antarctica shows, the radar altimeter is also important for measuring changes in the height of land ice.
Sentinel-3A’s topography package provides accurate topography measurements over sea ice, ice sheets, rivers, lakes and land. As this image of Antarctica shows, the radar altimeter is also important for measuring changes in the height of land ice. Image: ESA/modified Copernicus Sentinel data (2015), processed by UCL–MSSL
The image shows Greenland ice-sheet annual elevation change in 2015, but using a 25-year record of ESA satellite data, recent research shows that the pace at which Greenland is losing ice is getting faster. The research, published in Earth and Planetary Science Letters, uses radar altimetry data gathered by the ERS, Envisat and CryoSat missions between 1992 and 2016.
The image shows Greenland ice-sheet annual elevation change in 2015, but using a 25-year record of ESA satellite data, recent research shows that the pace at which Greenland is losing ice is getting faster. The research, published in Earth and Planetary Science Letters, uses radar altimetry data gathered by the ERS, Envisat and CryoSat missions between 1992 and 2016. Image: ESA/Planetary Visions
Onboard the Cryoegg are sensors that measure the temperature of the water underneath the ice, the pressure of the water underneath the ice and the electrical conductivity of that water. the Cryoegg can explore underneath the ice and send the data back in near real time.
Onboard the Cryoegg are sensors that measure the temperature of the water underneath the ice, the pressure of the water underneath the ice and the electrical conductivity of that water. the Cryoegg can explore underneath the ice and send the data back in near real time. Photo: Mike Prior-Jones
Vital supplies arrive by helicopter at the field camp on Sermeq Kujalleq, Greenland.
Vital supplies arrive by helicopter at the field camp on Sermeq Kujalleq, Greenland. Photo: Mike Prior-Jones
Surface meltwater ponds at Sermeq Kujalleq, Greenland. This meltwater will find its way to the bottom of the ice through a network of cracks, crevasses and moulins.
Surface meltwater ponds at Sermeq Kujalleq, Greenland. This meltwater will find its way to the bottom of the ice through a network of cracks, crevasses and moulins. Photo: Mike Prior-Jones
Meltwater channels on the surface of Russell Glacier in Greenland. The dark material is a mix of wind-blown dirt and microbial matter that can hasten the melting of the ice.
Meltwater channels on the surface of Russell Glacier in Greenland. The dark material is a mix of wind-blown dirt and microbial matter that can hasten the melting of the ice. Photo: LIz Bagshaw
Scientists working on the Greenland ice sheet as part of an international effort to develop new space technology to monitor our changing polar environment.
Scientists working on the Greenland ice sheet as part of an international effort to develop new space technology to monitor our changing polar environment. Photo: ESA/ Metasensing
This story is under the SDGIndustry, innovation and infrastructure

Build resilient infrastructure, promote inclusive and sustainable industrialization and foster innovation

Check out more
Under the patronage of

With the support of