Space observation helps us to monitor water quality and protect biodiversity
Kerstin Stelzer, Physical geographer - Brockmann Consult, Hamburg, Germany
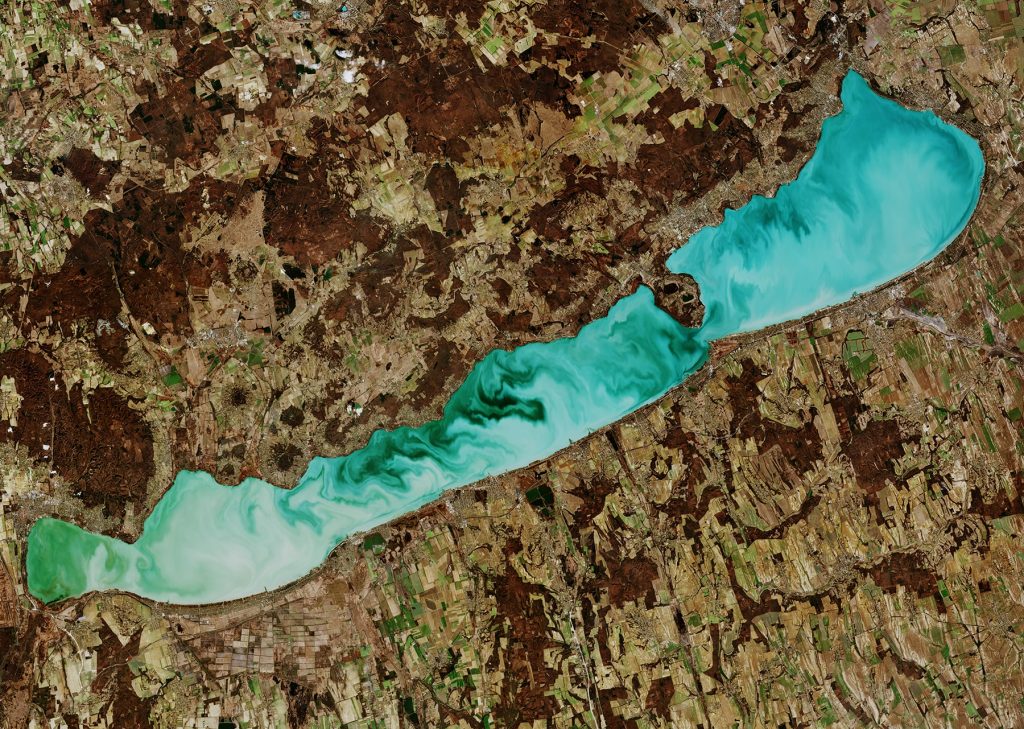
When using satellite data to assess water quality, the satellite-based instrument measures the light that is reflected from the water body. Within the water there are certain ingredients that influence the colour. We can detect algae blooms, which appear in green and observe their distribution. By combining these observations with in situ testing and models, we can provide users such as administrations, aquafarms and citizens with important information about the toxicity of these algae blooms and predict their growth and localisation.
Interview
My name is Kerstin Stelzer from Brockmann Consult. We are situated in Hamburg in Germany. We are small company that provides services and software related to or connected with satellite data and Earth observation. We provide products for users, especially for water and coastal applications. I am a physical geographer, and my special focus is remote sensing applications. I studied at the University of Trier. I have been working for 22 years at Brockmann Consult and I am head of the department of geo information services.
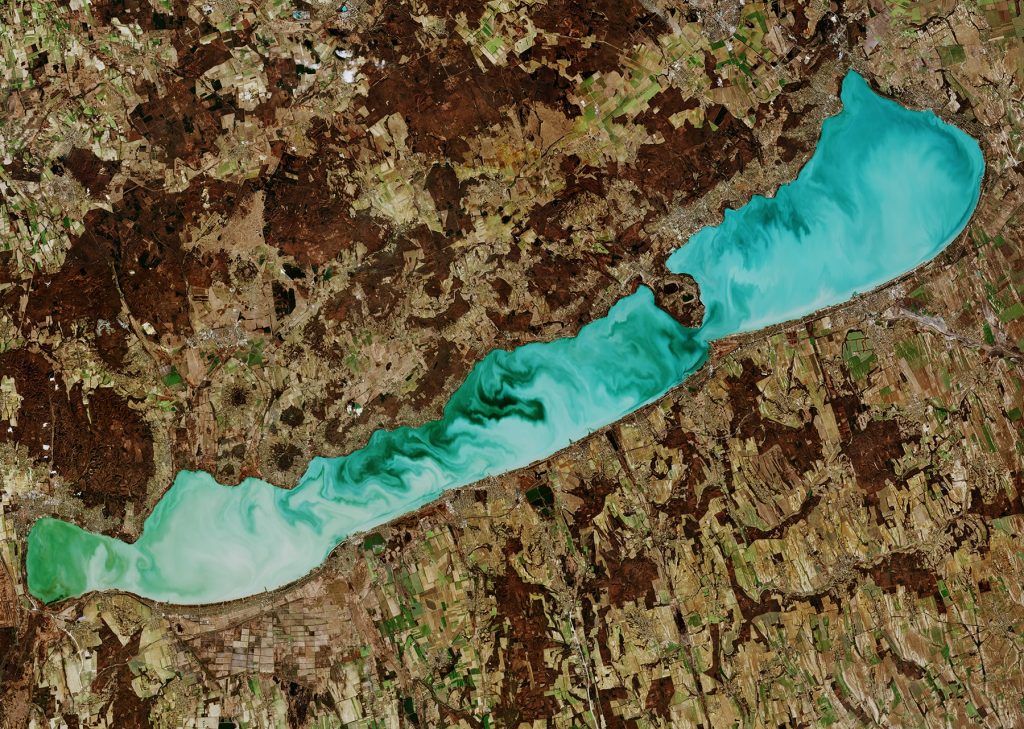
When using satellite data to assess water quality, the satellite-based instrument measures the light that is reflected from the water body. Within the water there are certain ingredients that influence the colour.
If, for instance, there is micro-algae, its green stuff will absorb the light in certain regions and reflect the green light so that the water appears green. If we have sediment in the water from rivers inland then this sediment reflects brown or yellow parts of light, so the water appears brownish or yellow depending on which sediment is in there. This colour information is what we use to see what’s in the water and its concentration.
My daily work involves a lot of communication, algorithm development and validation of our products. In terms of communication, we talk a lot with the users who use our data and services. Together with them we try to find out how they would like to work with our data so that we can support them with any questions they have. For instance, if someone sees an algae bloom in a lake and is worried what it is, that person calls the administration, which looks at the data that they get from us to see how big the algae bloom is and how it has grown in the last few days. There were also questions from an administration who wanted to hold a triathlon in the city of Hamburg. They wanted to swim in the river and in the Alster Lake but, in summer, bacteria could be in bloom, which might be toxic. So they had to test before the event whether the water was of good quality. They can see with satellite data where the blooms are and if they will be present in areas where athletes swim. Of course they also use in situ data to test this. They can therefore use a combination of the data relating to the distribution of different algae blooms and in situ data to tell them the exact concentrations at certain points.
Over recent years, there have been some lakes that show either algae blooms growing during the summer period or even declining. Measures have been taken by administrations to improve water quality and, in some lakes, you can really see in the satellite data that water quality has improved over the past years.
This is something that administrations talk to us about. We provide the tools and users analyse their lakes, but we also help them to understand the data because these are still new techniques for them.
On the one hand, we support administrations with data and services so that they can inform the population about events that might happen. For instance, in the very warm summer of 2018, a lot of lakes had a problem of bacteria blooms and the newspapers said that dogs were dying because they swim in those lakes and they were being affected by these harmful algae cyanobacteria blooms. It is of great interest to dog owners to know about the water quality of nearby lakes. If we look at the full picture and we observe all lakes in one part of the country then we can tell what the situation was in many different lakes that summer. This information can be acquired by satellite in one intervention, so we don’t need to have one thousand samples, just several images that tell us the story about the lakes around a country.
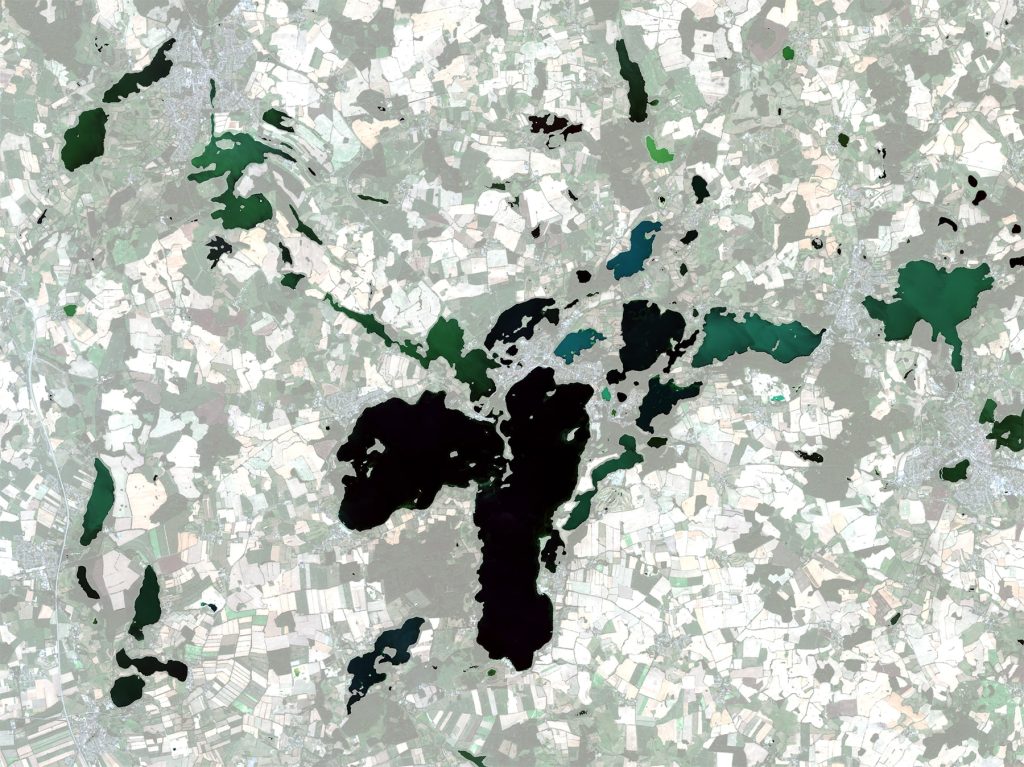
The SDG target 6.6 is the protection and restoration of freshwater systems. This target has an indicator, which is the tracking of changes to freshwater ecosystems. There is a tool that has been developed by UNEP that uses satellite data for looking into changes in freshwater ecosystems which gives the availability of water, water quality and the condition of wetlands and whether they are declining. There is another tool that uses Earth observation: the Freshwater Ecosystems Explorer, which uses Copernicus services among others to provide water quality information about globally distributed lakes. Any country can use this tool, ask for water quality within their country and report back to UNEP about the situation of their lakes.
Satellite data are seldom used alone, so it is always good to combine the different techniques we have. In situ data are still very important when working with satellite data. They are needed for measuring parameters that cannot be detected by Earth observation data. We can, for instance, measure chlorophyll concentration, but in situ measurements tell us which kind of algae are in a bloom and whether there any other substances like nutrients or coli bacteria which cannot be seen by satellite. This means measurements taken at different depths provide more information but satellite data provide us with the distribution of the bloom. Combining the advantages of different techniques is the key to obtaining a full picture of the environment.
On the other hand, we deal with models. Models can predict events for the future. So in a satellite image we gain an observation of that day and the days beforehand. With models, meanwhile, we can predict what is coming in one week or two. This is important for aquaculture. If a farmer sees that there is an algae bloom but doesn’t know if this algae bloom will affect his farm, then he won’t know what to do. With a combination of Earth observation and models he can be warned that, in 3 or 4 days, the algae bloom will be close to his farm so he can take measures against it.
Ensure the availability and sustainable management of water and sanitation for all
Check out more